A simple ray tracing and visualization tool for freespace optics.
dedicated to phys students working with freespace optics.


For documentation see online documentation on Read The Docs.
For examples of use check Examples.

pip install optical_tableor install from source:
git clone https://github.com/tim4431/optable.git
cd optable
pip install -e .Gaussian beam tracing
import numpy as np, matplotlib.pyplot as plt
from optable import *

wl = 780e-9
w0 = 10e-6

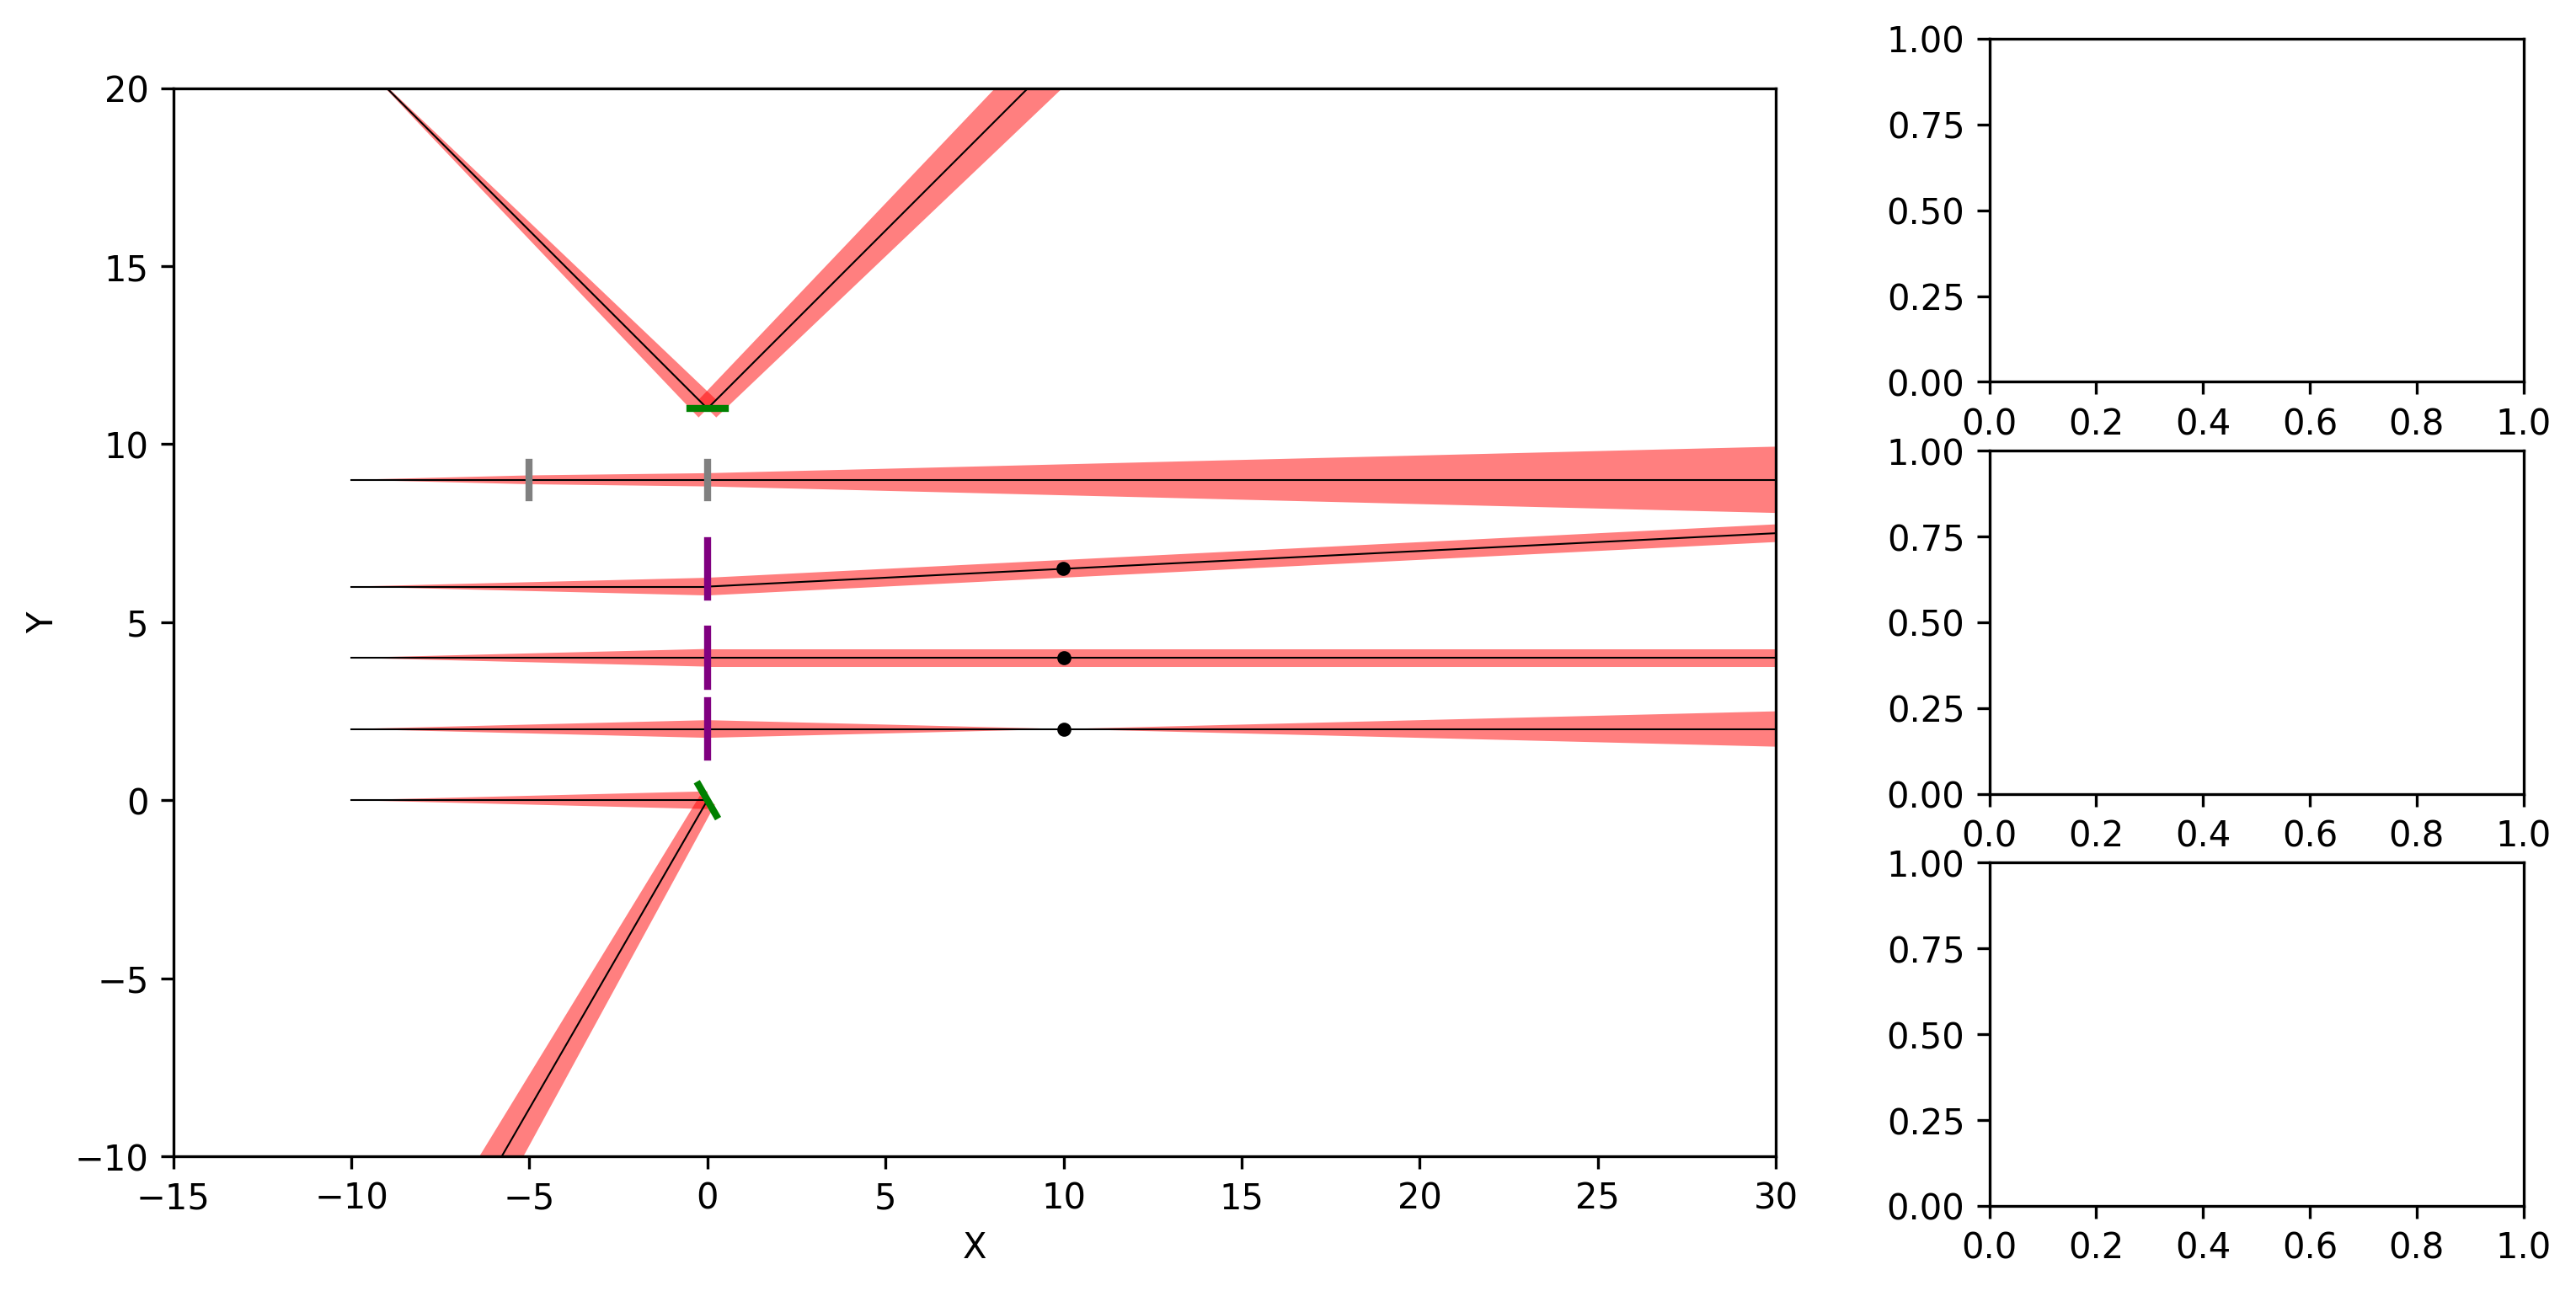
r0 = [
    Ray([-10, 0, 0], [1, 0, 0], wavelength=wl, w0=w0),
    Ray([-10, 2, 0], [1, 0, 0], wavelength=wl, w0=w0),
    Ray([-10, 4, 0], [1, 0, 0], wavelength=wl, w0=w0),
    Ray([-10, 6, 0], [1, 0, 0], wavelength=wl, w0=w0),
    Ray([-10, 9, 0], [1, 0, 0], wavelength=wl, w0=w0),
    Ray([-10, 21, 0], [1, 0, 0], wavelength=wl, w0=w0).RotZ(-np.pi / 4),
]

m0 = Mirror([0, 0, 0]).RotZ(np.pi / 6)
l0 = Lens([0, 2, 0], radius=0.8, focal_length=5)
l1 = Lens([0, 4, 0], radius=0.8, focal_length=10)
l2 = Lens([0, 6.5, 0], radius=0.8, focal_length=10)
slab0 = GlassSlab([0, 9, 0], n1=1, n2=2, thickness=5)
m1 = Mirror([0, 11, 0]).RotZ(-np.pi / 2)

rays = r0
components = [m0, l0, l1, l2, slab0, m1]

table = OpticalTable()
table.add_components(components)
table.ray_tracing(rays)

fig, ax0 = plt.subplots(1, 1, figsize=(12, 6))
table.render(
    ax0,
    type="Z",
    gaussian_beam=True,
    spot_size_scale=1,
    roi=[-15, 30, -10, 20],
)
plt.show()
Result