
Performance Co-Pilot (PCP) provides a framework and services to support system-level performance monitoring and management. It presents a unifying abstraction for all of the performance data in a system, and many tools for interrogating, retrieving and processing that data.
This Grafana app plugin integrates PCP metrics into Grafana, bundling three datasources and premade dashboards for real-time monitoring, historical analysis, and eBPF tracing.
- Grafana >= 12.4.3
- Performance Co-Pilot (PCP) with
pmcdandpmproxyrunning on the monitored host(s)- PCP Vector and PCP bpftrace connect to
pmproxyfor real-time metrics
- PCP Vector and PCP bpftrace connect to
- Valkey (or Redis) with
pmloggerarchiving metrics andpmproxyconfigured to write to the key server for the PCP Valkey datasource - bpftrace installed on the monitored host for the PCP bpftrace datasource
-
Install the plugin from the Grafana plugin catalog or with the Grafana CLI:
grafana cli plugins install performancecopilot-pcp-app
-
Enable the app plugin in Grafana under Administration > Plugins > Performance Co-Pilot and click Enable.
-
Configure a datasource under Connections > Data sources > Add data source:
- PCP Vector — for real-time metrics from a single host. Set the URL to your
pmproxyinstance (default:http://localhost:44322). - PCP Valkey — for historical metrics stored in Valkey/Redis. Set the URL to your
pmproxyinstance. - PCP bpftrace — for eBPF tracing scripts. Set the URL to your
pmproxyinstance.
- PCP Vector — for real-time metrics from a single host. Set the URL to your
-
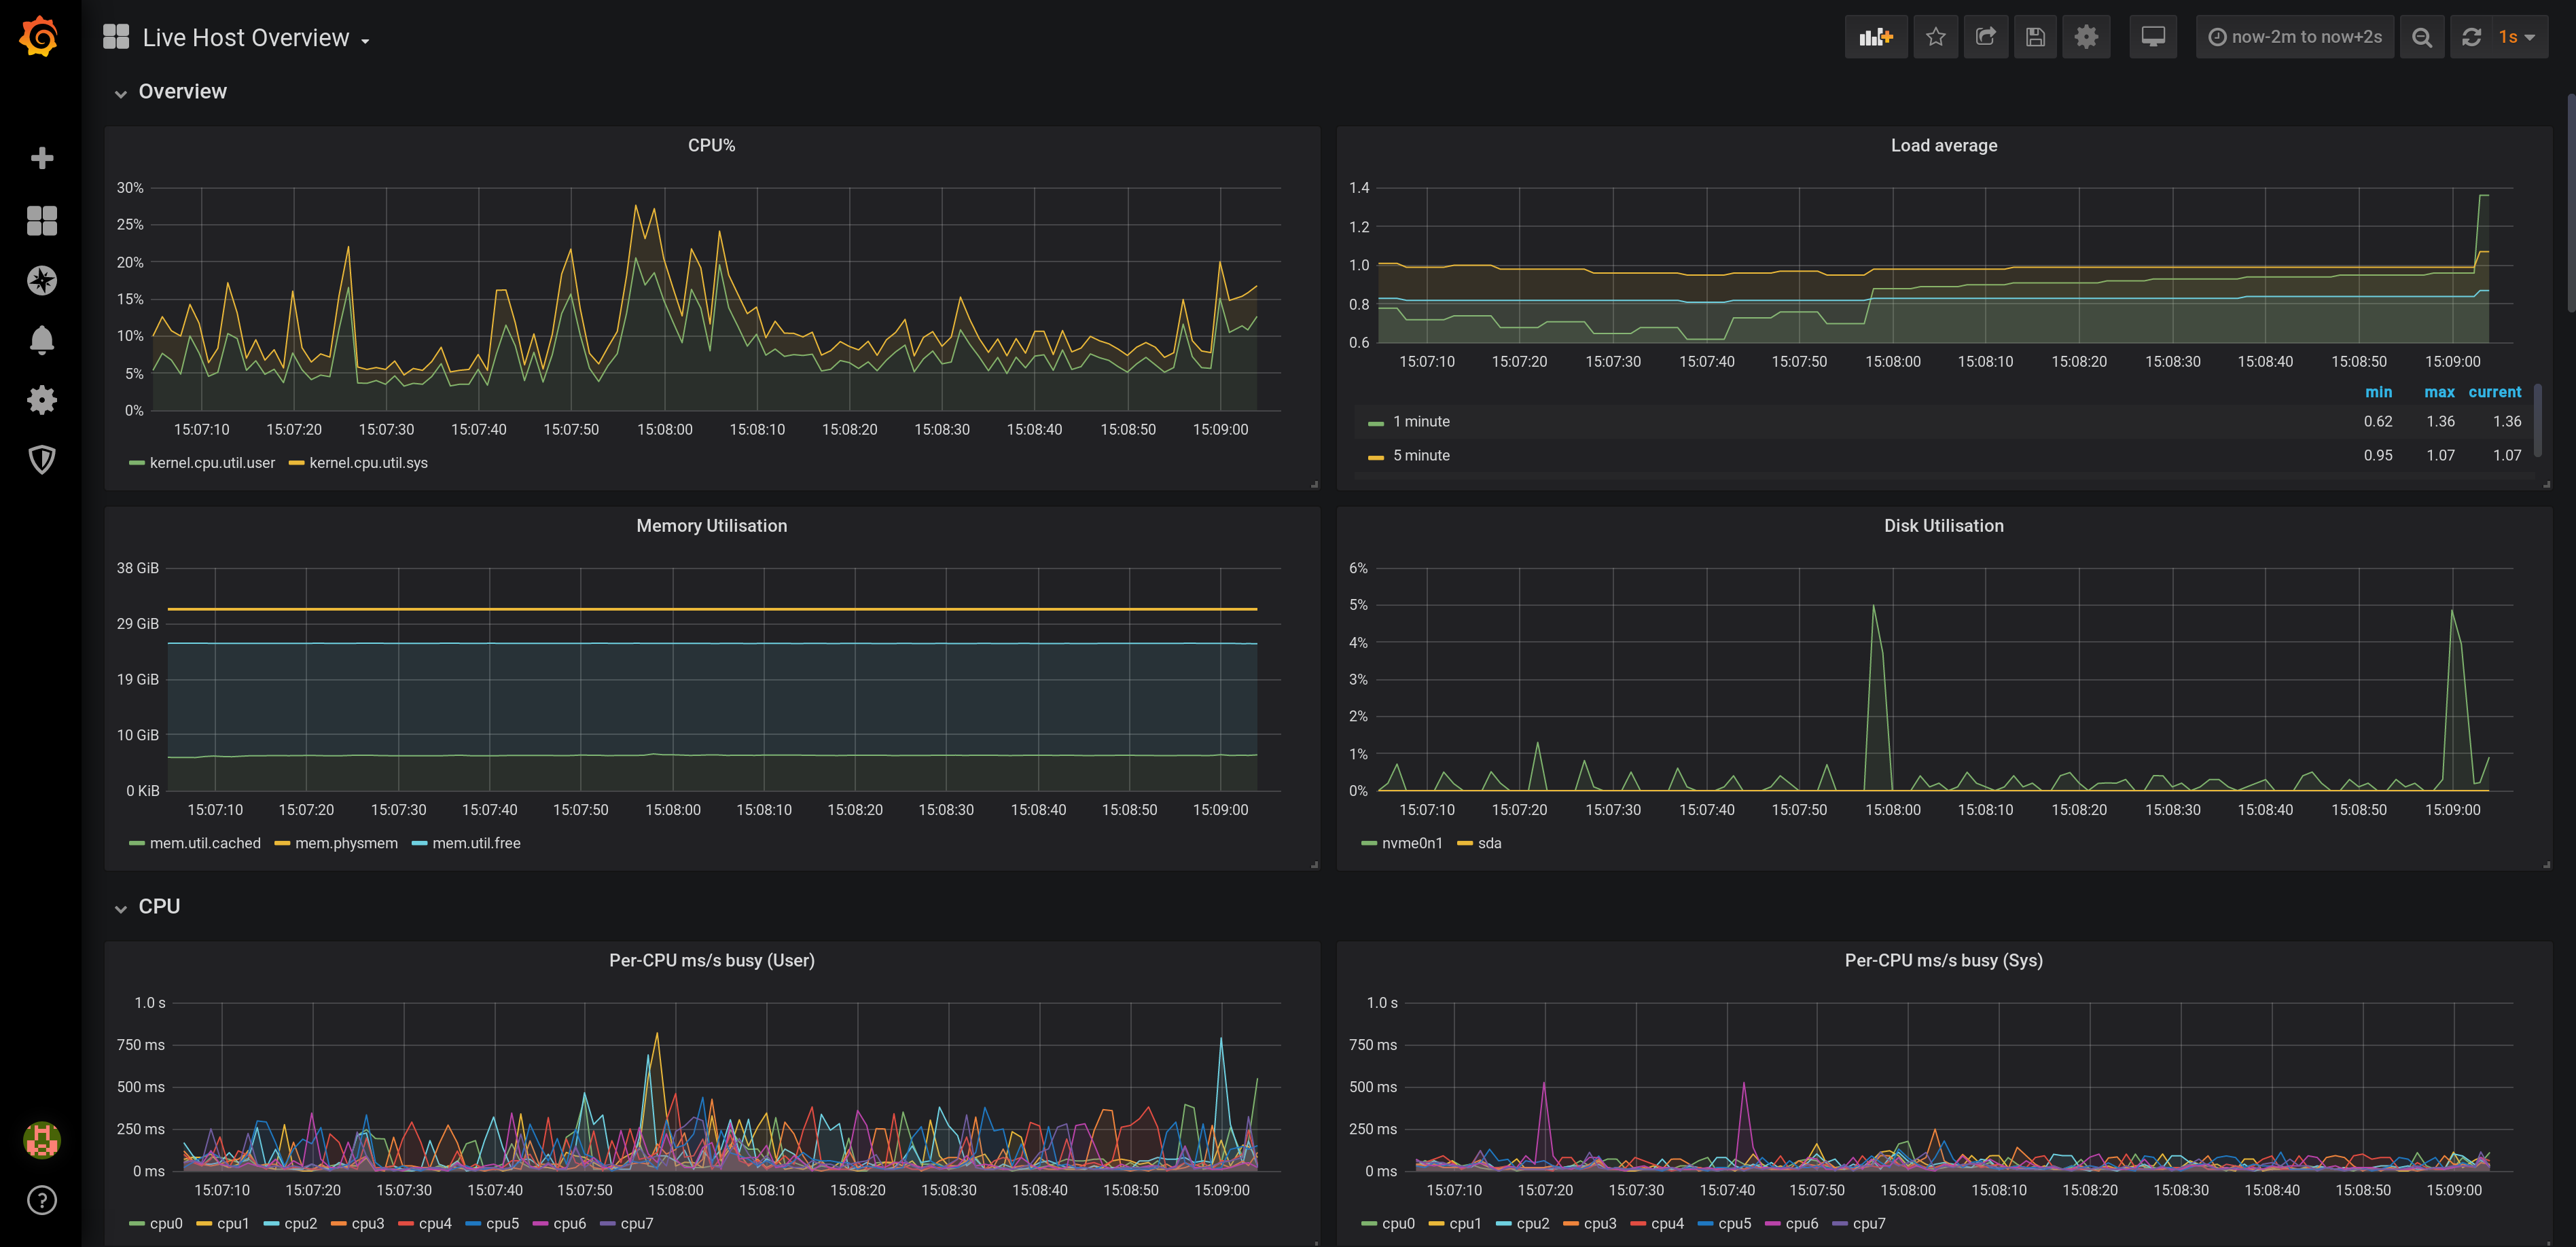
Import bundled dashboards from each datasource's settings page under the Dashboards tab. The PCP Vector Checklist dashboards use the USE method to detect potential performance issues.
- Analysis of historical PCP metrics using pmseries query language
- Analysis of real-time PCP metrics using pmwebapi live services
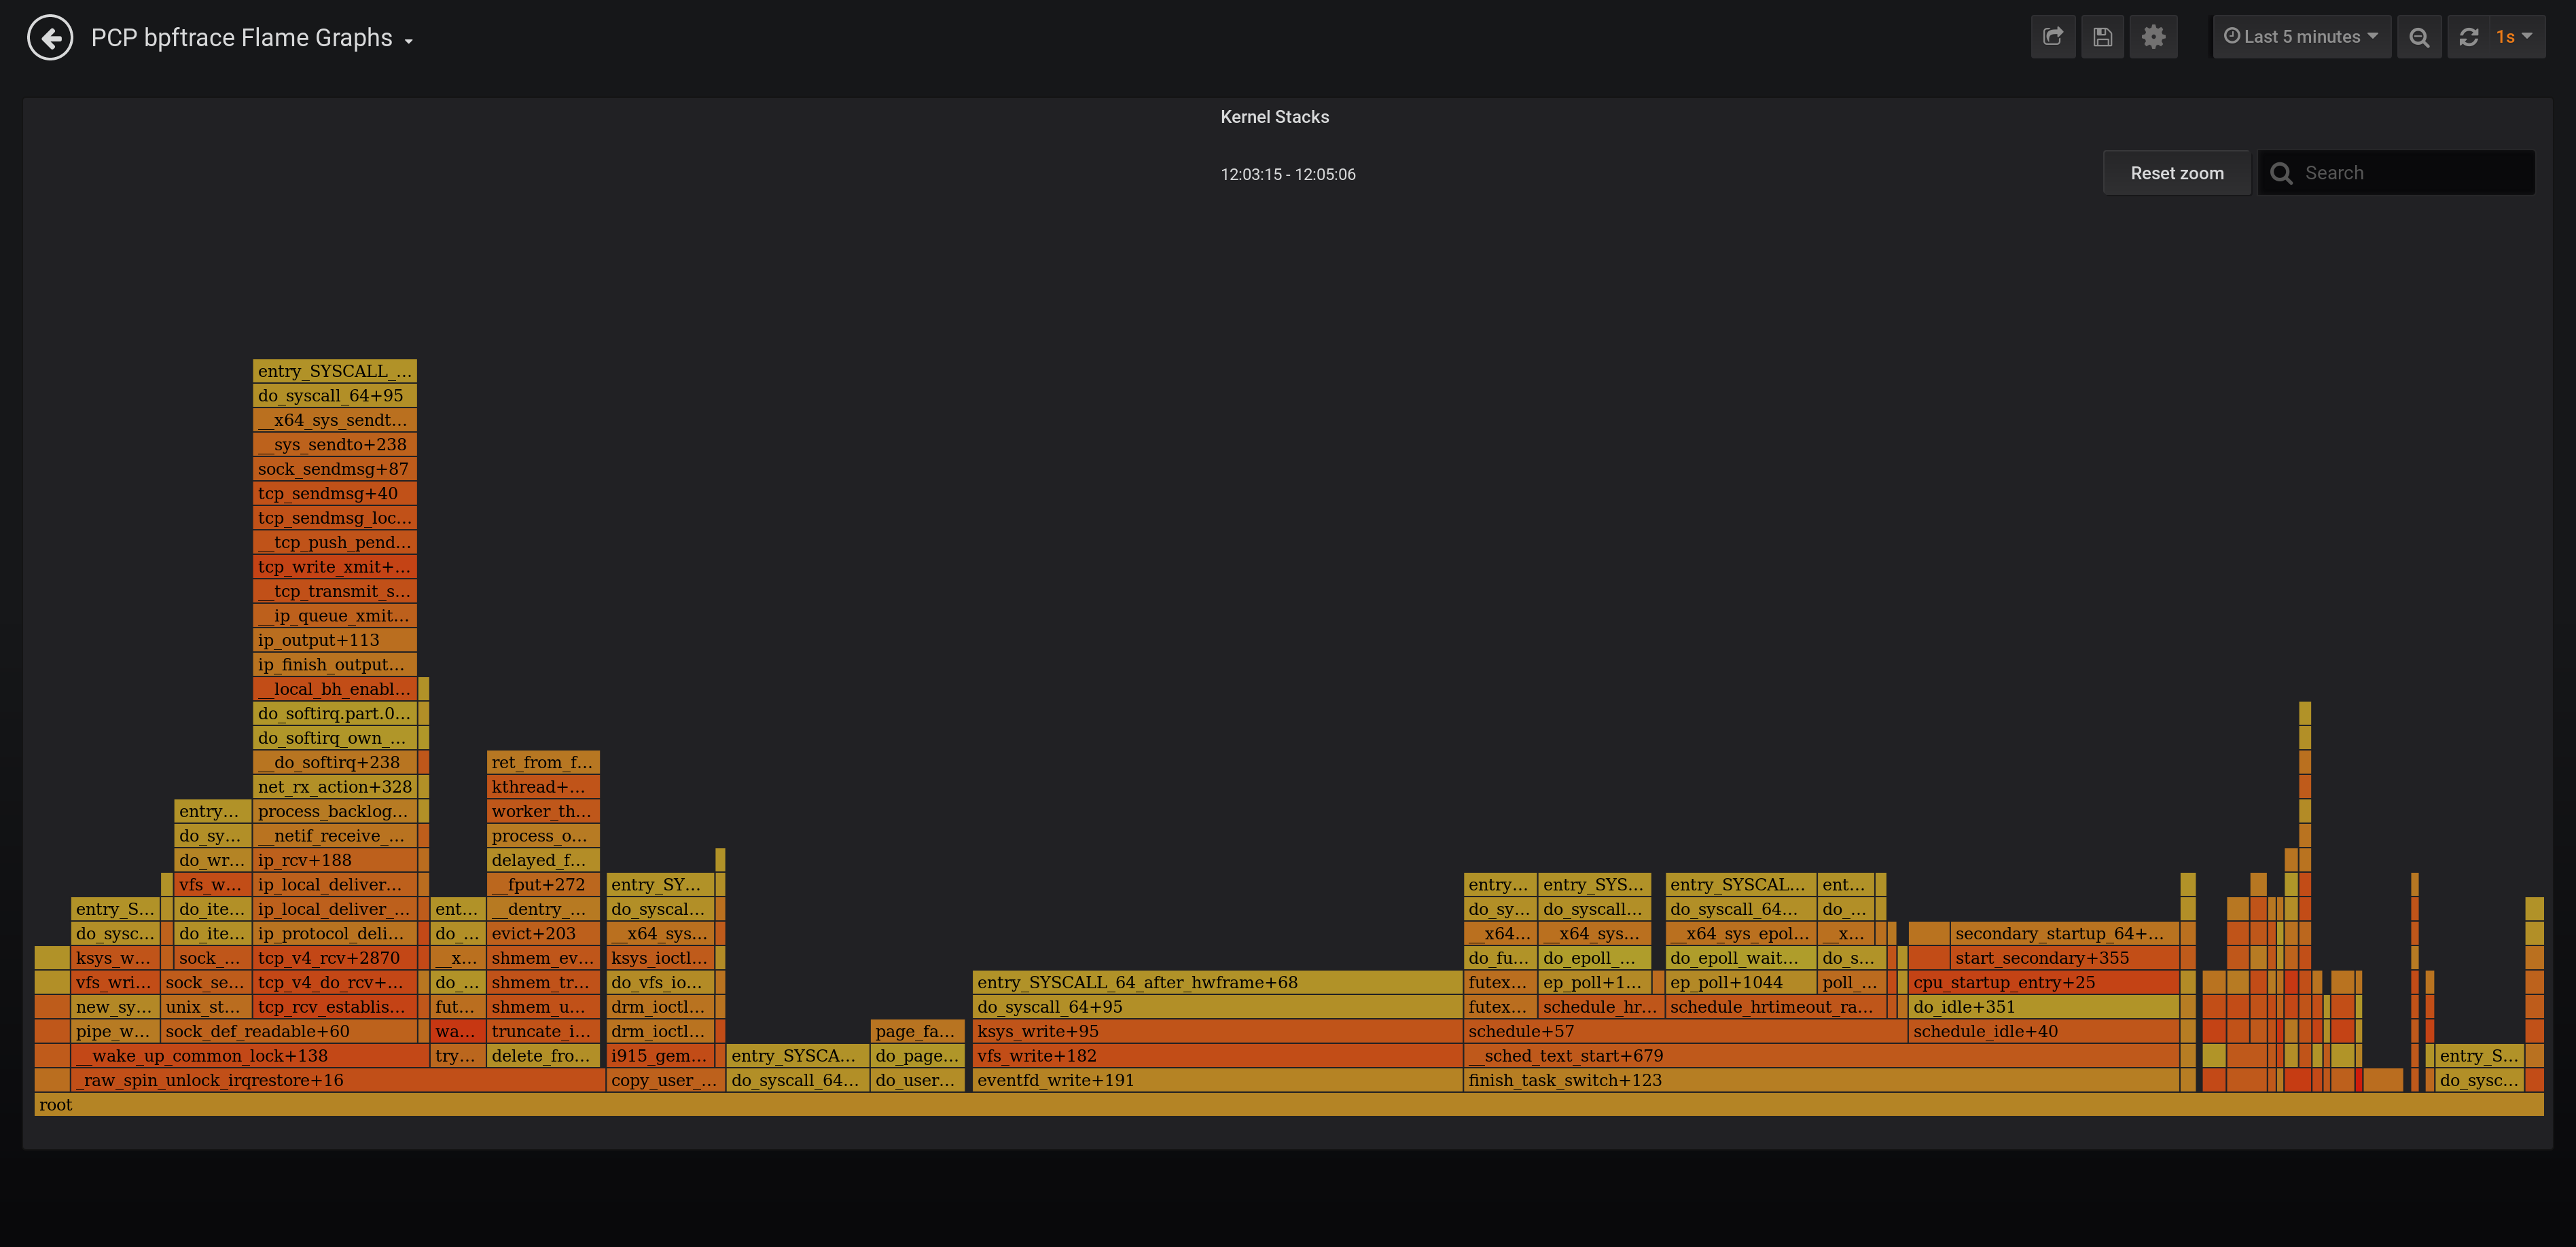
- Enhanced Berkeley Packet Filter (eBPF) tracing using bpftrace scripts
- Dashboards for detecting potential performance issues using the Utilization Saturation and Errors (USE) method [2]
- Full-text search in metric names, descriptions, instances [1]
- Support for Grafana Alerting [1]
- Support for derived metrics (arithmetic operators and statistical functions inside a query) [2]
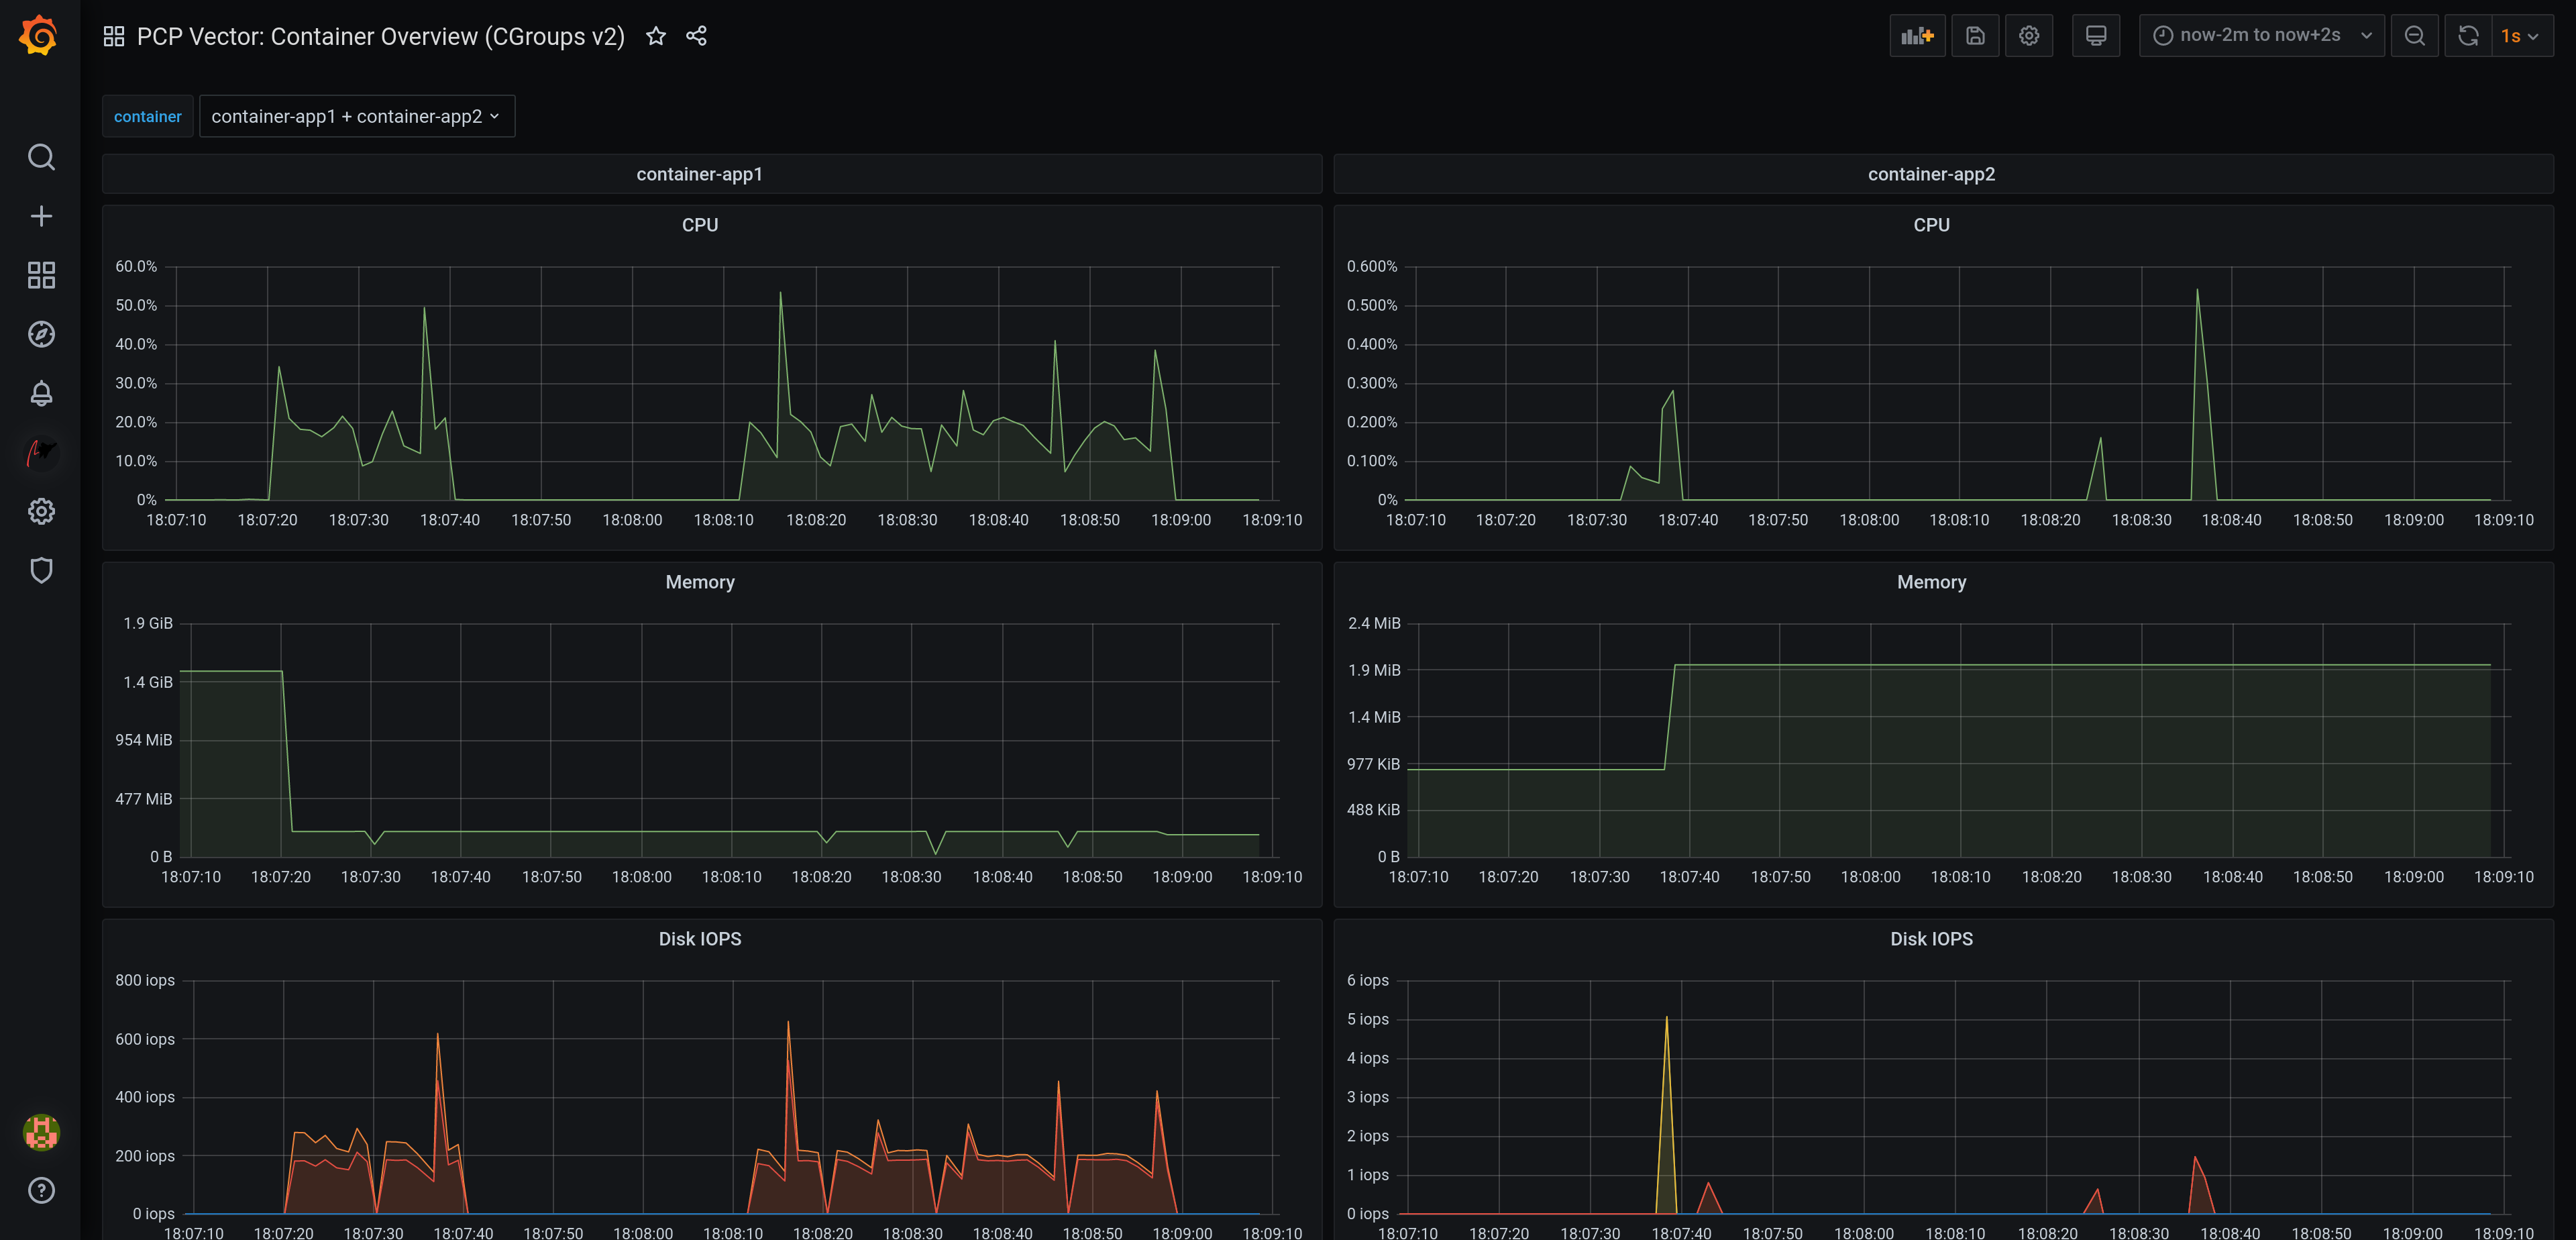
- Automated configuration of metric units [1,2,3]
- Automatic rate and time utilization conversion
- Heatmap, table [2,3] and flame graph [3] support
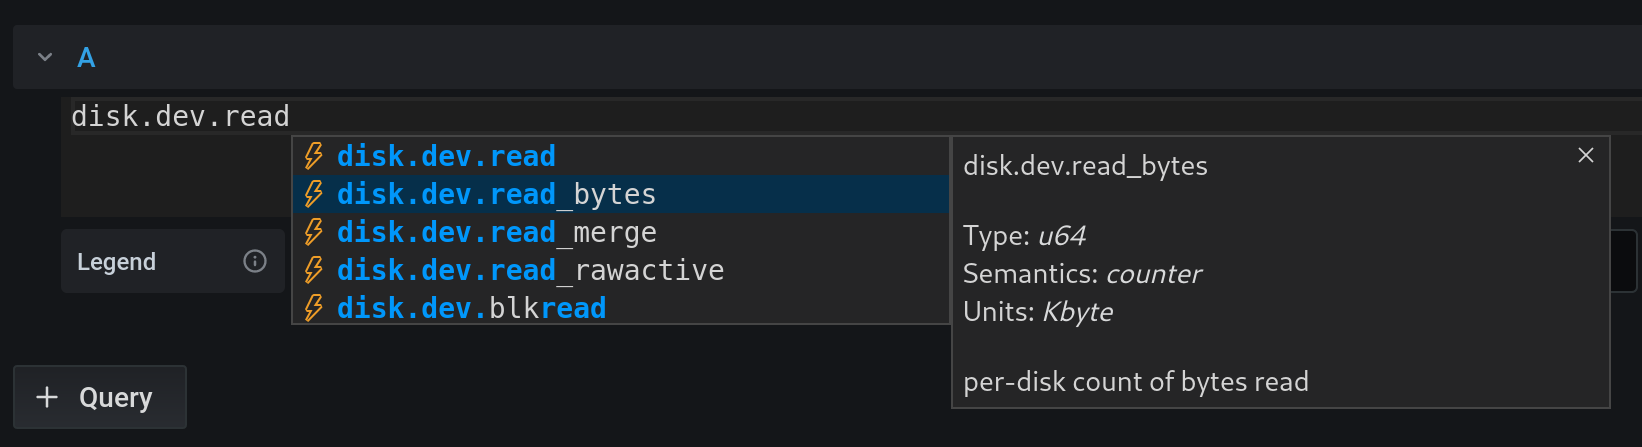
- Auto completion of metric names [1,2], qualifier keys and values [1], and bpftrace probes, builtin variables and functions [3]
- Display of semantics, units and help texts of metrics [2] and bpftrace builtins [3]
- Legend templating support with
$metric,$metric0,$instance,$some_label,$some_dashboard_variable - Container support [1,2]
- Support for custom endpoint and hostspec per panel [2,3]
- Support for repeated panels
- Sample dashboards for all datasources
[1] PCP Valkey [2] PCP Vector [3] PCP bpftrace