VgridPandas - Integrates Vgrid DGGS with GeoPandas and Pandas, inspired by H3-Pandas by Daniel Jahn.
VgridPandas supports a wide range of DGGSs, including H3, S2, A5, rHEALPix, DGGAL, DGGRID, OpenEAGGR ISEA4T, ISEA3H, EASE-DGGS, QTM, OLC, Geohash, GEOREF, MGRS, TileCode, Quadkey, Maidenhead, and GARS.








Full VgridPandas DGGS documentation is available at vgridpandas document.
To work with Vgrid in Python or CLI, use vgrid package. Full Vgrid DGGS documentation is available at vgrid document.
To work with Vgrid DGGS in QGIS, install the Vgrid Plugin.
To visualize DGGS in Maplibre GL JS, try the vgrid-maplibre library.
For an interactive demo, visit the Vgrid Homepage.

pip install vgridpandas --upgrade- Latlon to DGGS: Convert latitude and longitude coordinates into DGGS cell IDs.
- DGGS to geo boundary: Convert DGGS cell IDs into their corresponding geographic boundaries.
- (Multi)Linestring / (Multi)Polygon to DGGS: Convert (Multi)LineString via linetrace and (Multi)Polygon via polyfill, supporting compact option.
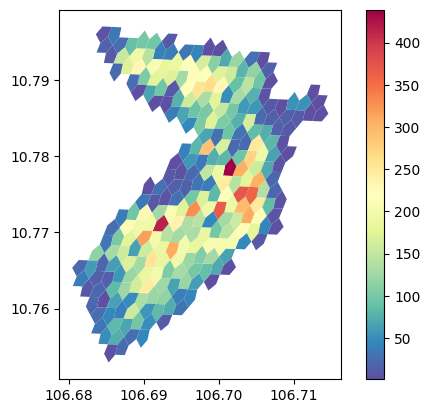
- DGGS binning: Aggregate points into DGGS cells, supporting common aggregations (count, min, max, etc.) and category-based groups.
import pandas as pd
from vgridpandas import h3pandas
df = pd.DataFrame({'lat': [10, 11], 'lon': [106, 107]})
resolution = 10
df = df.h3.latlon2h3(resolution, lat_col = 'lat', lat_col = 'lon')
df

| h3              |   lat |   lon |
|-----------------|-------|-------|
| 8a65a212199ffff |    10 |   106 |
| 8a65b0b68237fff | 11 | 107 |df = df.h3.h32geo()
df
| h3 | lat | lon | geometry |
|-----------------|-------|-------|-----------------|
| 8a65a212199ffff | 10 | 106 | POLYGON ((...)) |
| 8a65b0b68237fff | 11 | 107 | POLYGON ((...)) |import geopandas as gpd
from vgridpandas import s2pandas
gdf = gpd.read_file('https://raw.githubusercontent.com/opengeoshub/vopendata/main/shape/polygon.geojson')
resolution = 18
gdf_polyfill = gdf.s2.polyfill(resolution, compact = True, predicate = "intersects")
gdf_polyfill.head()
gdf_polyfill = gdf_polyfill.s2.s22geo("s2")
gdf_polyfill.plot(edgecolor = "white")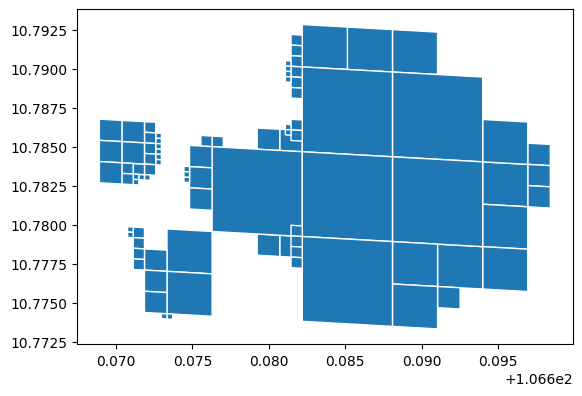
import pandas as pd

resolution = 4
df = pd.read_csv('https://raw.githubusercontent.com/opengeoshub/vopendata/main/csv/dist1_pois.csv')
agg = 'count'
df_bin = df.a5.a5bin(resolution=resolution,
                    lat_col='lat',
                    lon_col='lon',
                    agg=agg,
                    # numeric_col=numeric_col,
                    # category_col= category_col,
                    )
df_bin.plot(
    column=f'{numeric_col}_{agg}',
    cmap='Spectral_r',
    legend=True,
    linewidth=0.2,
)
For more examples, see the example notebooks.