English · 简体中文
See input and output token usage for every model, across local and cloud services.
A standalone DeepSeek Harness plugin with persistent, cross-session accounting. Open Settings → Token usage for activity, totals, and a breakdown by model and deployment.
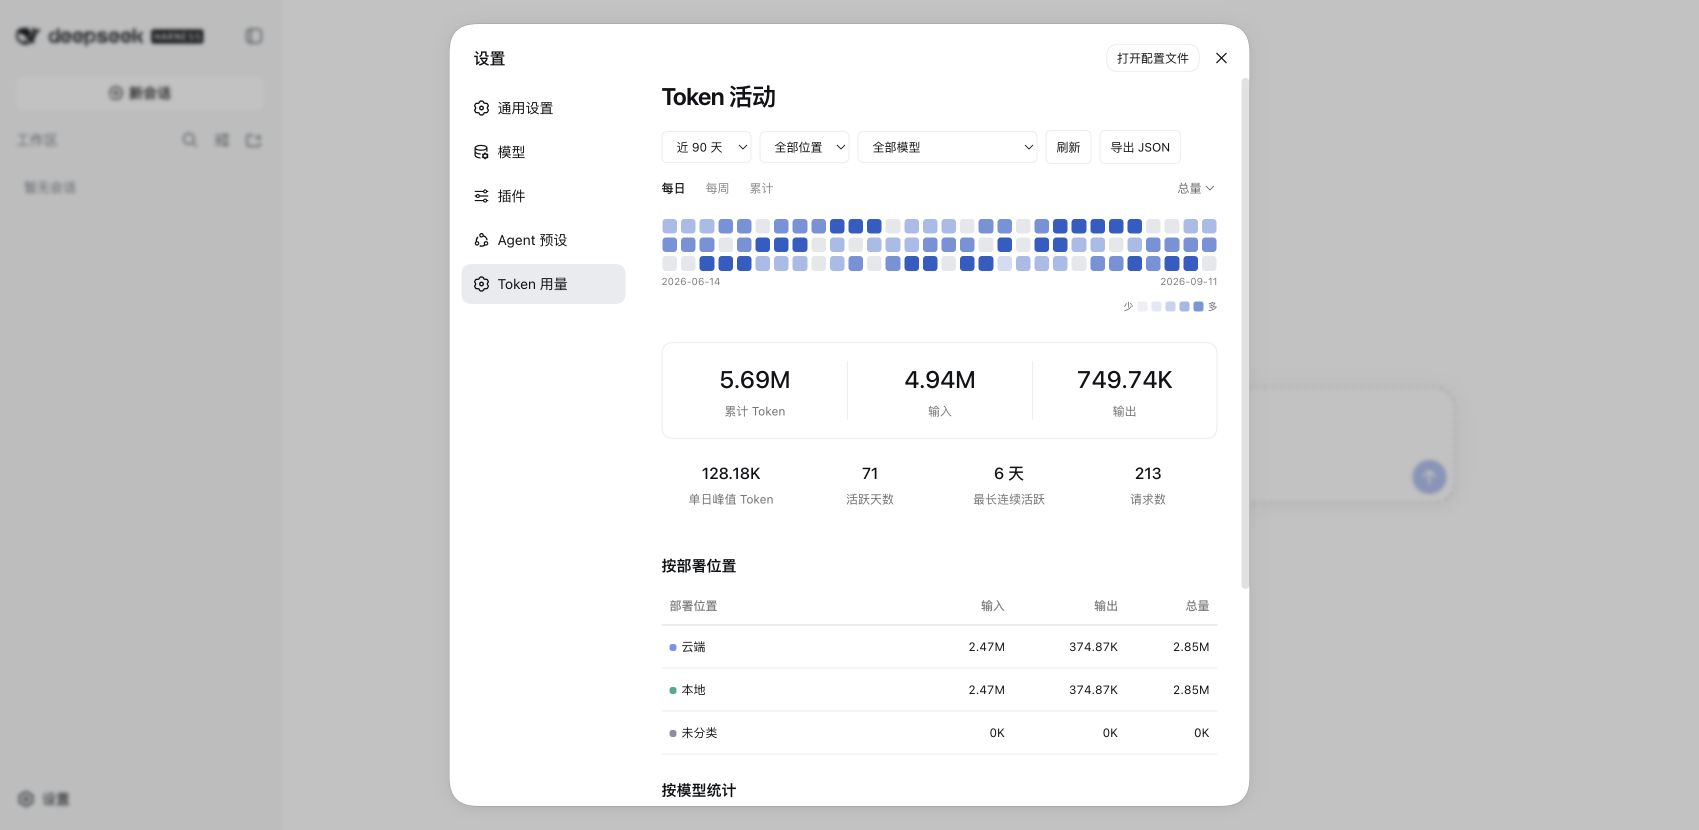
Screenshots use synthetic records in an isolated DSH instance. They demonstrate the interface, not measured inference.
Verified with DSH 0.1.6-alpha.1 / Cordis 4.0.2, on Node.js 24.20.0. Supported Node engine: ^22.19.0 || >=24.0.0. Other DSH versions are not yet verified.
dsh plugin --profile web add @geecraft23/dsh-token-usage@0.3.1Restart the corresponding DSH process after active tasks finish, reload the browser, and open Settings → Token usage. No additional API key or database server is required.
Install separately in other profiles by replacing web. Profiles sharing DSH_HOME share the default ledger. Live tracking starts when the plugin loads. Import older recorded usage from Import historical usage → Scan history → Import available records.
Scan stored sessions, review the available input/output and overlap counts, then import. The scan covers all dates and models regardless of dashboard filters. After import, choose View all time to see the recovered activity. Repeated scans and imports retain existing counts; cancelling preserves completed records so you can scan again to continue. Local/cloud classifications also apply to imported routes.
Only usage saved by DSH can be recovered. The coverage report lists missing usage, unreadable sessions, unresolved overlaps, inherited fork records, and title requests without saved response usage. Uncertain overlaps are skipped. Imported request dates use the earliest recorded stream chunk, or the compaction start time when available. This can differ from the original request start time.
On first upgrade from ledger version 1, a consistent .v1-backup-<id>.sqlite file is saved beside the ledger before its atomic migration to version 2. Update all profiles sharing that ledger to 0.3 before restarting them; earlier plugin versions cannot reopen it. Restoring the backup also discards records collected after that backup.
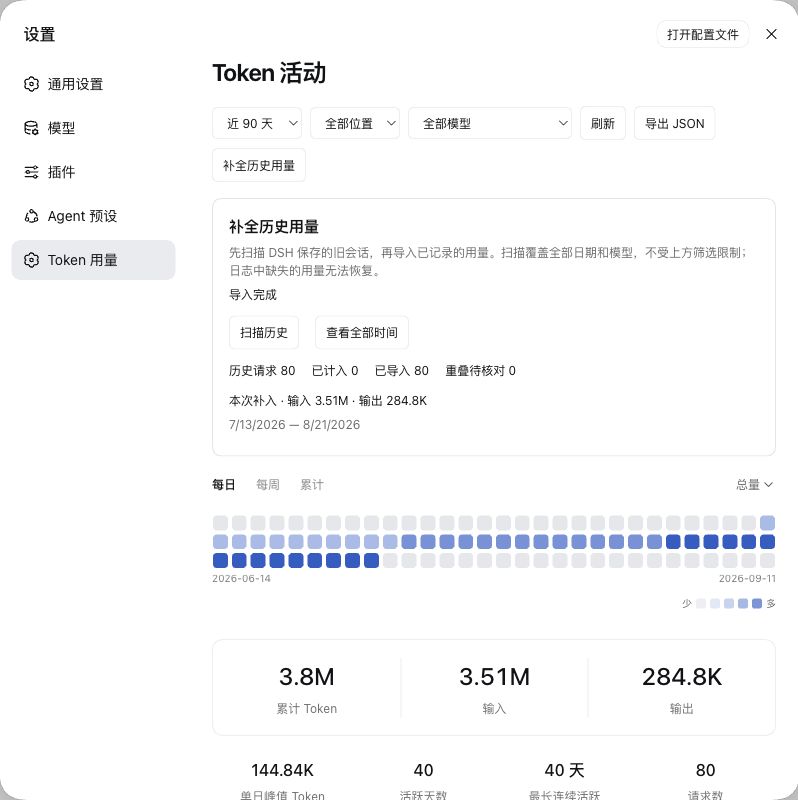
See history accounting and limits and validation.
Deployment and token direction are independent: choose All / Local / Cloud, then inspect Total / Input / Output using the same accounting rules. The redesigned dashboard adds an activity calendar, weekly and cumulative views, peak daily usage, active days, and longest active streak. Filter an exact provider-model route and export the selection.
The 0.2 dashboard retained existing records and classifications. New configuration and JSON exports use local / cloud; exports carry formatVersion: 2. See configuration compatibility when upgrading older configuration.
- Per-model accounting: group by provider and model, keeping identical model names on different services separate.
- Local/cloud classification: assign a source to each route; changes apply to historical and future records. Unknown routes remain unclassified.
- Independent dimensions: compare local and cloud input, output and totals using the same columns.
- Activity first: 90 days by default, with 30-day, all-time, and custom ranges. Every date has a rounded tile: soft gray means no recorded requests; four blue levels show usage relative to the selected peak.
- Readable numbers: K for thousands, M from one million, B from one billion. Hover for exact counts; JSON exports keep complete integers.
- Trends and export: daily, weekly, and cumulative views; filter deployment and model independently, then export the selection.
- Durable local storage: SQLite survives restarts and session deletion. Missing usage, failures, and unfinished requests remain visible.
- Native settings page: English and Chinese copy, with DSH light/dark theme support.
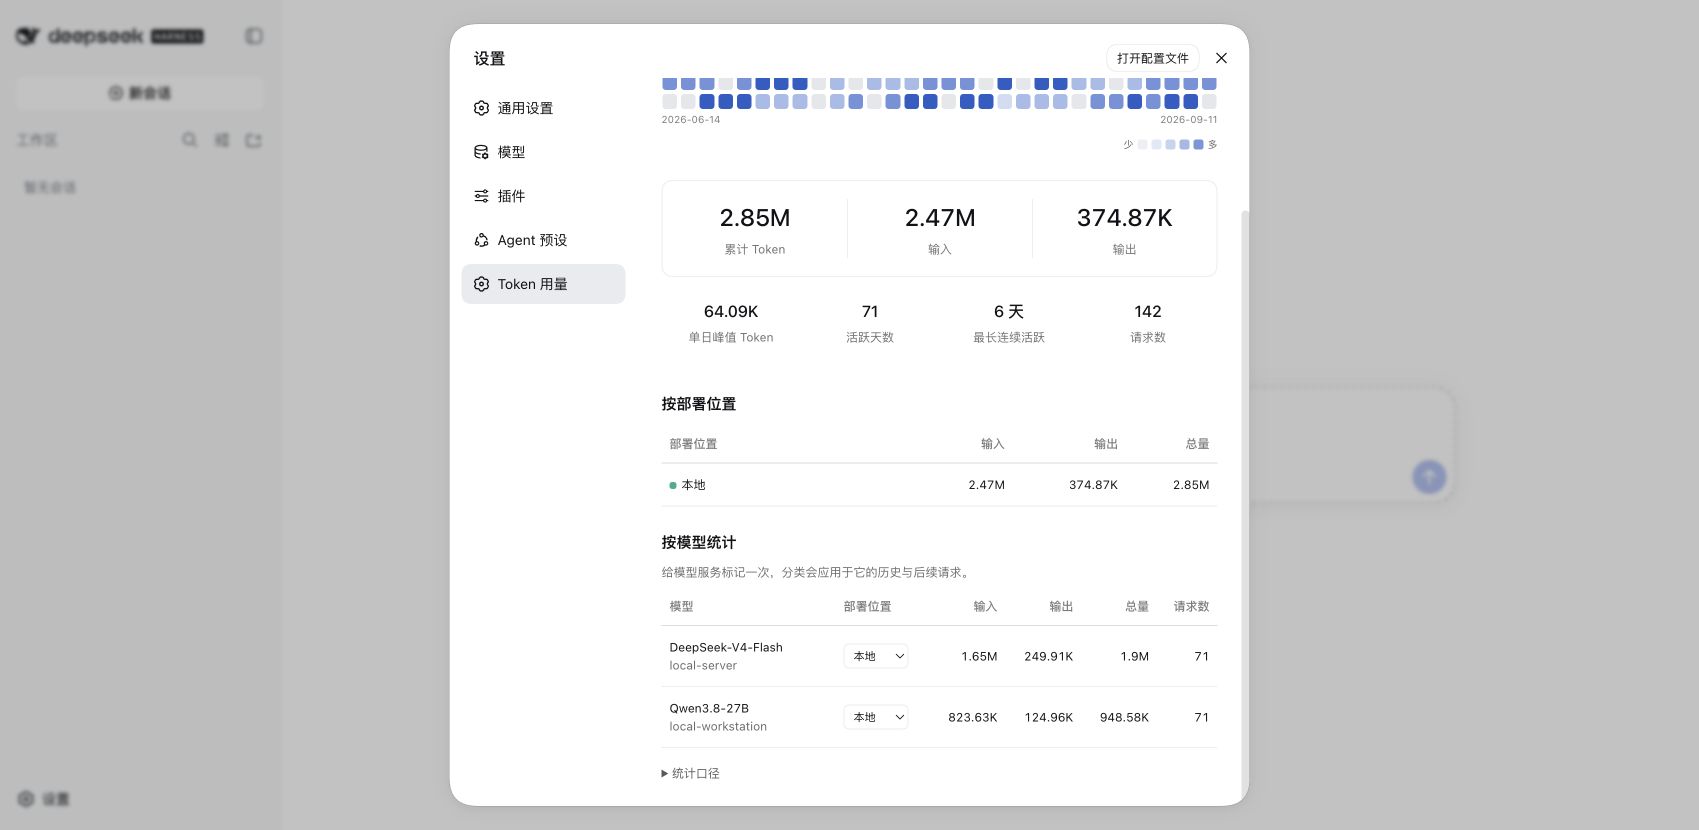
These are independent dimensions. Local and cloud each have input, output, and total tokens:
| Deployment | Input | Output | Total |
|---|---|---|---|
| Local | Tokens sent to self-managed models | Tokens returned by those models | Input + output |
| Cloud | Tokens sent to hosted model services | Tokens returned by those services | Input + output |
The calendar follows the selected period, deployment, model, and token metric. All-time and custom calendars show up to 366 days; totals and trends cover the full selection. Dates without recorded requests remain gray. Requests with unreported usage remain visible as activity, but their unknown token counts are not estimated.
Displayed input is uncached input + cache reads + cache writes. Total is input + output. Reasoning is already included in output. Repeated history is counted for each request, while cumulative streaming usage snapshots replace previous values for the same request.
Requests without usage are marked as missing, not estimated. Totals represent reported usage, not a billing statement or remaining subscription quota. Local/cloud is your classification: a local machine, LAN server, self-hosted remote service, or rented GPU may all be marked local. Model names and URLs are not used to guess it.
The ledger stores request IDs, timestamps, provider/model IDs, session IDs, purposes, status, counters, and history identity/counter fingerprints. It does not store prompts, answers, endpoint URLs, API keys, or cookies. The default file is $DSH_HOME/token-usage/usage.sqlite, or ~/.dsh/token-usage/usage.sqlite when unset. There is no automatic cross-machine synchronization.
Failed and cancelled calls retain usage already reported. Calls made by external agents need the plugin installed in their own DSH process. Simulated providers are also observed; keep tests in an isolated DSH_HOME.
Add settings to your profile's cordis.patch.yml:
- id: token-usage
  config:
    databasePath: /absolute/path/to/usage.sqlite
    busyTimeoutMs: 1000
    rules:
      - provider: deepseek
        source: cloud
      - provider: your-self-hosted-provider
        source: local
Rules match exact provider IDs; add model for a model-specific rule. A model rule overrides a provider rule, and classifications saved in the UI override both. Leave databasePath unset for the shared default. Use local storage, not a network filesystem; back up with SQLite tooling or stop writers first. Unsupported ledger versions and invalid configuration fail to load.
Daily grouping uses the browser's current fixed UTC offset, rather than historical daylight-saving rules. Storage failures do not interrupt model responses; the page reports a warning, and unsaved records can be lost on process exit.
See validation evidence and detailed accounting notes in Chinese.
pnpm install --frozen-lockfile
pnpm run typecheck
pnpm test
pnpm run build
pnpm pack --dry-run
Install a development checkout with dsh plugin --profile web add link:/absolute/path/to/dsh-token-usage. Restart DSH after Host or Bundle changes.
Uninstall with dsh plugin --profile web remove @geecraft23/dsh-token-usage. The ledger is retained.