Skip to content

Fix regression due to memory allocations. - #831

Open
DiamonDinoia wants to merge 1 commit into
masterfrom
feat/mmap-fwbatch-alloc
Open

Fix regression due to memory allocations. #831
DiamonDinoia wants to merge 1 commit into
masterfrom
feat/mmap-fwbatch-alloc

Conversation

@DiamonDinoia

@DiamonDinoia DiamonDinoia commented Mar 12, 2026

Copy link
Copy Markdown
Collaborator

I run some benchmarks recently and found some (hefty) regressions in a couple of cases:
192x192x128-type-2-upsamp2 00-precd-thread0
250x250x250-type-1-upsamp2 00-precd-thread1

It is possible to see that 2.5.0 sometimes is killed by memory allocation and the checkout on the right recovers all the performance.

I added a new class finufft::ReclaimableMemory which reserves the memory does not allocate it so the plan remains small (overhead is some pointers).

I also added a test for the class.q
There is now a TSAN thread since 2.5.0 execute is thread safe so, I tested also this property.

@lu1and10

Copy link
Copy Markdown
Member

is the first plot on the cluster machine, could you also post the one on your laptop machine, your laptop machine does not have the organge one, right?

@DiamonDinoia

DiamonDinoia commented Mar 12, 2026

Copy link
Copy Markdown
Collaborator Author
Metric v2.2.0 v2.3.0 v2.4.0 v2.5.0 HEAD
Makeplan (ms) 5 3 58 63 5
Setpts (ms) 77 79 57 67 35
Execute (ms) 945 1040 893 950 914
Amortized (ms) 1027 1122 1008 1080 954
Speedup vs v2.2.0 1.000x 0.915x 1.019x 0.951x 1.077x

bench.py takes too much time on my laptop but this is a summary of what I see. It takes tens of ms to do malloc but not 100s of ms. This is using fftw.

@DiamonDinoia
DiamonDinoia requested a review from mreineck March 12, 2026 22:25
@DiamonDinoia

Copy link
Copy Markdown
Collaborator Author

@mreineck I added you since this sort-of undoes something you changed.

@mreineck

Copy link
Copy Markdown
Collaborator

I'll check tomorrow!

Independent of all this: if malloc or other allocation routines have large overhead, there are probably easier ways to improve things than introducing complicated internal memory management. It can be done by adjusting the behavior of the allocator via a couple of environment variables. I can provide examples if that is an acceptable solution.

Could you please paste the benchmark script?

@mreineck

Copy link
Copy Markdown
Collaborator

Unfortunately the M value is cut off in the plot above ... I assume this is a very "sparse" test case (M<<N1*N2*N3)?

@DiamonDinoia

Copy link
Copy Markdown
Collaborator Author

The script I used is here:

Params("d", 192, 192, 128, 1, 0, 1e7, 1e-7),

(With some changes I'll push tomorrow) and in particular is that case

@mreineck

Copy link
Copy Markdown
Collaborator

I think I can explain the recent overhead in makeplan: at some point we switched from raw malloced buffers to vectors, and vectors are zero-initialized. That takes a lot of time, especiallly since FFTW in ESTIMATE mode doesn't touch the buffer at all. With Marco's recent fix to the planning stage, all the overhead in makeplan should already be gone, without the need for reclaimable memory etc.

It's not that I don't like the approach, which is pretty cool ... but this adds (in my opinion) an unnecessarily large maintenance burden in relation to the gains.

@mreineck

Copy link
Copy Markdown
Collaborator

These are the results I get if I include current master in the benchmarks. I think the loss of 5% in an extreme corner case should be OK...
192x192x128-type-2-upsamp2 00-precd-thread0
250x250x250-type-2-upsamp2 00-precd-thread1

@mreineck

Copy link
Copy Markdown
Collaborator

We may be able to save some more time by switching from vector types to some sort of raw vectors that don't initialize their memory on construction. Not sure if that's worth it though.

@DiamonDinoia

Copy link
Copy Markdown
Collaborator Author

It's very machine dependant.
I might move the reclaimable buffer in poet as I think is generally useful across projects. That would justify the maintenance.

Alternatively, we could switch to a better alllocator like rpmalloc to avoid maintenance

@ahbarnett ahbarnett left a comment

Copy link
Copy Markdown
Collaborator

Choose a reason for hiding this comment

The reason will be displayed to describe this comment to others. Learn more.

Hi Marco, I'm really glad you took the initiative to measure the regression, figure out the cause, and look into a possible solution. The history is that I originally allocated fwBatch in the plan stage, then Martin moved it to the execute in 2.5.0, but I'm confused why having FFTW plan allocate is slower than in 2.2.0 (didn't this do the same?).
Why can't we go back to 2.2.0 style allocation? (this used more RAM than some users liked, eg the t1+t2 plans each used RAM).
Ie, why can't we just undo the thing that caused the regression?

I thought we were going to discuss having an opts switch for where allocations were done, if Martin's alloc-in-exec turned out to cause slowdowns? (I'm not sure how this would interact with the execute_adjoint, which is now a feature we have to maintain).

Like Martin, I am worried about introducing such low-level platform-specific code into FINUFFT - it has to be maintained for the rest of time, even when platforms change and update. That is a pain, and not many people can do it or understand it. Is there no simpler way to pin such memory? (eg xsimd is maintained and tested by other people, so I'm fine using it... it is not our job long-term).

So, I think we all need to summarize the state of affairs here and discuss as a team before moving ahead... otherwise we'll keep adding more and more complicated Marco code to the project. I want the code to stay as simple as possible while still being somewhat close to best performance.

@@ -0,0 +1,75 @@
#include <finufft.h>

Copy link
Copy Markdown
Collaborator

Choose a reason for hiding this comment

The reason will be displayed to describe this comment to others. Learn more.

What does this new CI tester do? Documentation at the top of the code is needed.

Comment thread .github/workflows/cmake_sanitizers.yml Outdated
include:
- { os: ubuntu-22.04, toolchain: gcc-13 }
- { os: macos-14, toolchain: llvm }
- { os: ubuntu-22.04, toolchain: gcc-13, sanitizer: ON }

Copy link
Copy Markdown
Collaborator

Choose a reason for hiding this comment

The reason will be displayed to describe this comment to others. Learn more.

Is this part of a different PR? Else what is its connection to the PR?

// Note: spreadinterp.cpp compilation time grows with the gap between these bounds...
inline constexpr int min_nc_given_ns(int ns) {
return std::max(common::MIN_NC, ns - 4); // note must stay in bounds from constants.h
return (std::max)(common::MIN_NC, ns - 4); // note must stay in bounds from constants.h

Copy link
Copy Markdown
Collaborator

Choose a reason for hiding this comment

The reason will be displayed to describe this comment to others. Learn more.

why the parens here? std::max doesn't usually need (std::max). A code comment is needed

Comment thread include/finufft/memory.hpp Outdated
#define WIN32_LEAN_AND_MEAN
#endif
#ifndef NOMINMAX
#define NOMINMAX

Copy link
Copy Markdown
Collaborator

Choose a reason for hiding this comment

The reason will be displayed to describe this comment to others. Learn more.

what is this? docs...

@@ -0,0 +1,136 @@
#pragma once

// Cross-platform RAII wrapper for large temporary buffers.

Copy link
Copy Markdown
Collaborator

Choose a reason for hiding this comment

The reason will be displayed to describe this comment to others. Learn more.

This file scares me - how are we going to maintain this as part of FINUFFT as platforms change? Is there no such service offered in a standard C++ library that someone else supports? (like xsimd). I also thought you said it was going to be "10 lines" :)

@mreineck

Copy link
Copy Markdown
Collaborator

Let me try to disentangle the situation a little. It is complicated, but I think it's not as bad as it looks...

There are two aspects to the slowdown:

  • my patch shifted memory allocation to the plan execution stage. That means that for every execution, memory must be allocated - and (due to my sloppiness) I also allocated and deallocated the buffer during the planning stage, when that was actually not necessary (i.e. when FFTW was used in ESTIMATE mode or when ducc was used). This latter part has already been fixed by Marco in workflow draft #629.

  • As part of my patch we also switched to xsimd vectors instead of raw malloc'ed memory, which is more in line with the C+ philosophy that no resource should ever be left uninitialized. This causes an additional slowdown, which could also be fixed without a large effort ... all we need to do is to fall back to fftw_malloc when using FFTW, or plain malloc when using ducc.

However in my opinion this is not necessary, since the overhead I could measure was only 5% in a case that's practically pure FFT and no spread/interpolation. I would consider that acceptable.

Going back to "the plan holds onto the buffers" is something I would only do if there is hard evidence that this is required after the mitigations above have been implemented.

@DiamonDinoia

DiamonDinoia commented Mar 14, 2026

Copy link
Copy Markdown
Collaborator Author

Hi team,

Thanks for the feedback, this discussion is the reason I opened the PR. I would say that a 5% is acceptable for now and it can be recovered by better tuning sigma; smaller FFT -> smaller allocation.

xsimd is a SIMD wrapper not a memory management library so it is not the right place for this. We could use allocators like RPmalloc but I do not want to bring an extra dependency for 10 lines of code (it is the ifdef and comments that blow it up... as well as c++ RAII boilerplate). I think this class can live for example in POET. The API it uses is either posix or posix-like. AFAIK it has not changed in the last 15 years at least, I used the linux only version of class for 10ish years. They added more options to give more control but they did not break old code. So I am not worried about maintaining it more that it is generally useful and should live somewhere else.

I do not like the idea of pre-allocating the FFT scratch as if all the lib pre allocate all the scratches very quickly we will run out of memory. Also, pre allocating while maintaining thread safety of execute and const correctness requires static thead_local scratches that then somehow destroy has to clean? None of this is worth the effort. I'd rather keep thread safety and const correctness.

So, most of the code in this PR is for testing const correctness and thread safety. I suggest we merge it as it is a good idea to test these assertions. Then for the scratch we for now leave the allocation as-is and if this scratch is merged in POET we use it from there. This way if the scratch breaks in future kernel releases reverting to a aligned vector is a small change.

@ahbarnett

Copy link
Copy Markdown
Collaborator

OK, thanks for the discussion. It's good to know this new memory.hpp has been stable for 10-15 yrs, and yes I think it should sit somewhere else if it's generally useful, and we make that a new header-only dependency.
I'll be happy to merge, but only after you've inserted some comments as per my review - should take a few minutes. Thanks! Alex

Use mmap+MADV_FREE for persistent fwBatch buffer in execute,
making concurrent execute calls thread-safe without repeated
allocation. Includes lazy fwBatch allocation in makeplan and
Windows min/max macro collision fixes.
@DiamonDinoia
DiamonDinoia force-pushed the feat/mmap-fwbatch-alloc branch from 02de82d to 7bbaa21 Compare August 20, 2026 18:51
@flatiron-jenkins

Copy link
Copy Markdown
Collaborator

CPU

A band that brackets 1.00 resolved nothing; read the table, not the point estimate.

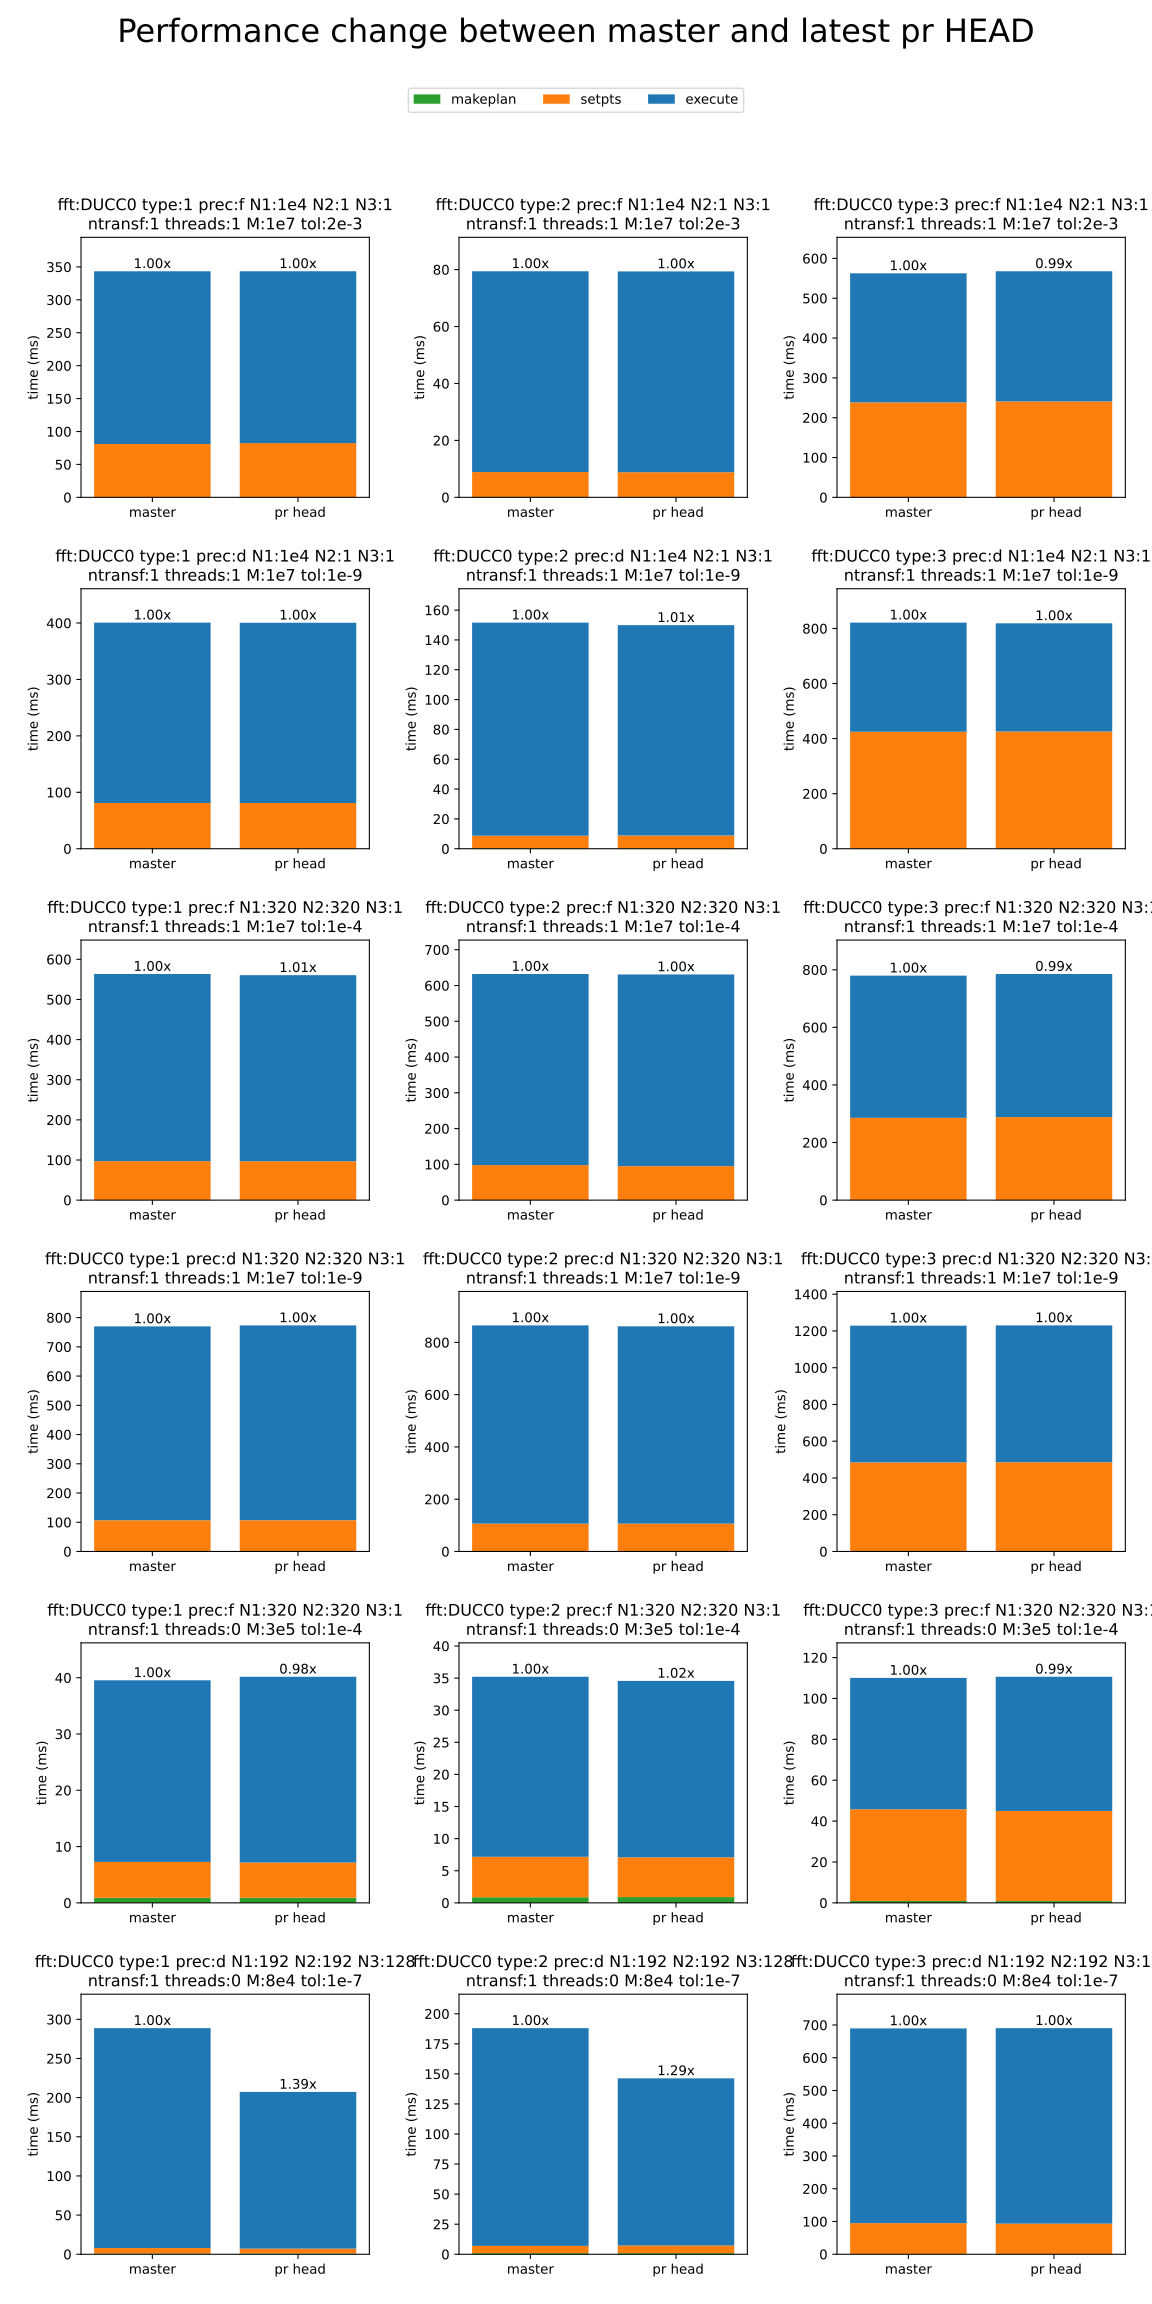
FFT backends: DUCC0. Intel(R) Xeon(R) Gold 6140 CPU @ 2.30GHz, 64 usable processors, 32 physical cores, x86-64-v4. Baseline master 9810998.

perftest plot

FINUFFT perftest plot

how the benchmarks are measured

Ratio is master/PR-head time: >1 means the PR is faster. Time is makeplan plus setpts plus execute on both halves; the GPU host transfers stage the harness's own test data, so no library change moves them and they are left out. Each case runs 8 rounds with the two binaries interleaved and their order alternating; each arm is tabulated at its median round and the band spans the per-round ratios. A ratio is bold where the band excludes 1.00, which is where the run resolved a change; every other row resolved nothing. Every option a caller may leave alone is left alone (sorting, upsampling factor, kernel choice), so a change to one of finufft's heuristics shows up here as the change in time it causes. The thread count is the exception: a case is defined by the count it runs at.

per-case timings
case master (ms) PR head (ms) ratio band
fft:DUCC0 type:1 prec:f N1:1e4 N2:1 N3:1 ntransf:1 threads:1 M:1e7 tol:2e-3 343.36 343.40 1.00x 0.94-1.01
fft:DUCC0 type:2 prec:f N1:1e4 N2:1 N3:1 ntransf:1 threads:1 M:1e7 tol:2e-3 79.41 79.35 1.00x 0.99-1.09
fft:DUCC0 type:3 prec:f N1:1e4 N2:1 N3:1 ntransf:1 threads:1 M:1e7 tol:2e-3 562.60 567.79 0.99x 0.98-0.99
fft:DUCC0 type:1 prec:d N1:1e4 N2:1 N3:1 ntransf:1 threads:1 M:1e7 tol:1e-9 400.70 400.51 1.00x 1.00-1.01
fft:DUCC0 type:2 prec:d N1:1e4 N2:1 N3:1 ntransf:1 threads:1 M:1e7 tol:1e-9 151.60 149.90 1.01x 0.97-1.02
fft:DUCC0 type:3 prec:d N1:1e4 N2:1 N3:1 ntransf:1 threads:1 M:1e7 tol:1e-9 821.31 818.76 1.00x 1.00-1.13
fft:DUCC0 type:1 prec:f N1:320 N2:320 N3:1 ntransf:1 threads:1 M:1e7 tol:1e-4 563.40 560.51 1.01x 0.99-1.01
fft:DUCC0 type:2 prec:f N1:320 N2:320 N3:1 ntransf:1 threads:1 M:1e7 tol:1e-4 632.17 630.89 1.00x 0.97-1.05
fft:DUCC0 type:3 prec:f N1:320 N2:320 N3:1 ntransf:1 threads:1 M:1e7 tol:1e-4 779.64 785.31 0.99x 0.99-1.00
fft:DUCC0 type:1 prec:d N1:320 N2:320 N3:1 ntransf:1 threads:1 M:1e7 tol:1e-9 769.92 773.36 1.00x 0.99-1.00
fft:DUCC0 type:2 prec:d N1:320 N2:320 N3:1 ntransf:1 threads:1 M:1e7 tol:1e-9 865.19 861.62 1.00x 0.95-1.02
fft:DUCC0 type:3 prec:d N1:320 N2:320 N3:1 ntransf:1 threads:1 M:1e7 tol:1e-9 1228.81 1230.25 1.00x 1.00-1.00
fft:DUCC0 type:1 prec:f N1:320 N2:320 N3:1 ntransf:1 threads:0 M:3e5 tol:1e-4 39.54 40.17 0.98x 0.97-0.99
fft:DUCC0 type:2 prec:f N1:320 N2:320 N3:1 ntransf:1 threads:0 M:3e5 tol:1e-4 35.21 34.57 1.02x 0.96-1.07
fft:DUCC0 type:3 prec:f N1:320 N2:320 N3:1 ntransf:1 threads:0 M:3e5 tol:1e-4 110.06 110.62 0.99x 0.89-1.18
fft:DUCC0 type:1 prec:d N1:192 N2:192 N3:128 ntransf:1 threads:0 M:8e4 tol:1e-7 288.73 207.29 1.39x 0.97-1.82
fft:DUCC0 type:2 prec:d N1:192 N2:192 N3:128 ntransf:1 threads:0 M:8e4 tol:1e-7 188.05 146.30 1.29x 1.17-1.35
fft:DUCC0 type:3 prec:d N1:192 N2:192 N3:128 ntransf:1 threads:0 M:8e4 tol:1e-7 689.66 690.44 1.00x 0.85-1.17
microarchitecture and compiler

Microarchitecture: skylake_avx512

Compiler: c++ (GCC) 13.3.1 20240611 (Red Hat 13.3.1-2)

Flags: -march=native

perftest commands
taskset -c 1 master/build-DUCC0/perftest/perftest --arg --prec=f --N1=1e4 --N2=1 --N3=1 --ntransf=1 --threads=1 --M=1e7 --tol=2e-3 --n_runs=5 --sort=2 --upsampfact=0 --debug=0 --type=1
taskset -c 1 master/build-DUCC0/perftest/perftest --arg --prec=f --N1=1e4 --N2=1 --N3=1 --ntransf=1 --threads=1 --M=1e7 --tol=2e-3 --n_runs=5 --sort=2 --upsampfact=0 --debug=0 --type=2
taskset -c 1 master/build-DUCC0/perftest/perftest --arg --prec=f --N1=1e4 --N2=1 --N3=1 --ntransf=1 --threads=1 --M=1e7 --tol=2e-3 --n_runs=5 --sort=2 --upsampfact=0 --debug=0 --type=3
taskset -c 6 master/build-DUCC0/perftest/perftest --arg --prec=d --N1=1e4 --N2=1 --N3=1 --ntransf=1 --threads=1 --M=1e7 --tol=1e-9 --n_runs=5 --sort=2 --upsampfact=0 --debug=0 --type=1
taskset -c 6 master/build-DUCC0/perftest/perftest --arg --prec=d --N1=1e4 --N2=1 --N3=1 --ntransf=1 --threads=1 --M=1e7 --tol=1e-9 --n_runs=5 --sort=2 --upsampfact=0 --debug=0 --type=2
taskset -c 6 master/build-DUCC0/perftest/perftest --arg --prec=d --N1=1e4 --N2=1 --N3=1 --ntransf=1 --threads=1 --M=1e7 --tol=1e-9 --n_runs=5 --sort=2 --upsampfact=0 --debug=0 --type=3
taskset -c 3 master/build-DUCC0/perftest/perftest --arg --prec=f --N1=320 --N2=320 --N3=1 --ntransf=1 --threads=1 --M=1e7 --tol=1e-4 --n_runs=5 --sort=2 --upsampfact=0 --debug=0 --type=1
taskset -c 3 master/build-DUCC0/perftest/perftest --arg --prec=f --N1=320 --N2=320 --N3=1 --ntransf=1 --threads=1 --M=1e7 --tol=1e-4 --n_runs=5 --sort=2 --upsampfact=0 --debug=0 --type=2
taskset -c 3 master/build-DUCC0/perftest/perftest --arg --prec=f --N1=320 --N2=320 --N3=1 --ntransf=1 --threads=1 --M=1e7 --tol=1e-4 --n_runs=5 --sort=2 --upsampfact=0 --debug=0 --type=3
taskset -c 8 master/build-DUCC0/perftest/perftest --arg --prec=d --N1=320 --N2=320 --N3=1 --ntransf=1 --threads=1 --M=1e7 --tol=1e-9 --n_runs=5 --sort=2 --upsampfact=0 --debug=0 --type=1
taskset -c 8 master/build-DUCC0/perftest/perftest --arg --prec=d --N1=320 --N2=320 --N3=1 --ntransf=1 --threads=1 --M=1e7 --tol=1e-9 --n_runs=5 --sort=2 --upsampfact=0 --debug=0 --type=2
taskset -c 8 master/build-DUCC0/perftest/perftest --arg --prec=d --N1=320 --N2=320 --N3=1 --ntransf=1 --threads=1 --M=1e7 --tol=1e-9 --n_runs=5 --sort=2 --upsampfact=0 --debug=0 --type=3
master/build-DUCC0/perftest/perftest --prec=f --N1=320 --N2=320 --N3=1 --ntransf=1 --threads=0 --M=9600000 --tol=1e-4 --n_runs=5 --sort=2 --upsampfact=0 --debug=0 --type=1
master/build-DUCC0/perftest/perftest --prec=f --N1=320 --N2=320 --N3=1 --ntransf=1 --threads=0 --M=9600000 --tol=1e-4 --n_runs=5 --sort=2 --upsampfact=0 --debug=0 --type=2
master/build-DUCC0/perftest/perftest --prec=f --N1=320 --N2=320 --N3=1 --ntransf=1 --threads=0 --M=9600000 --tol=1e-4 --n_runs=5 --sort=2 --upsampfact=0 --debug=0 --type=3
master/build-DUCC0/perftest/perftest --prec=d --N1=192 --N2=192 --N3=128 --ntransf=1 --threads=0 --M=2560000 --tol=1e-7 --n_runs=5 --sort=2 --upsampfact=0 --debug=0 --type=1
master/build-DUCC0/perftest/perftest --prec=d --N1=192 --N2=192 --N3=128 --ntransf=1 --threads=0 --M=2560000 --tol=1e-7 --n_runs=5 --sort=2 --upsampfact=0 --debug=0 --type=2
master/build-DUCC0/perftest/perftest --prec=d --N1=192 --N2=192 --N3=128 --ntransf=1 --threads=0 --M=2560000 --tol=1e-7 --n_runs=5 --sort=2 --upsampfact=0 --debug=0 --type=3

GPU

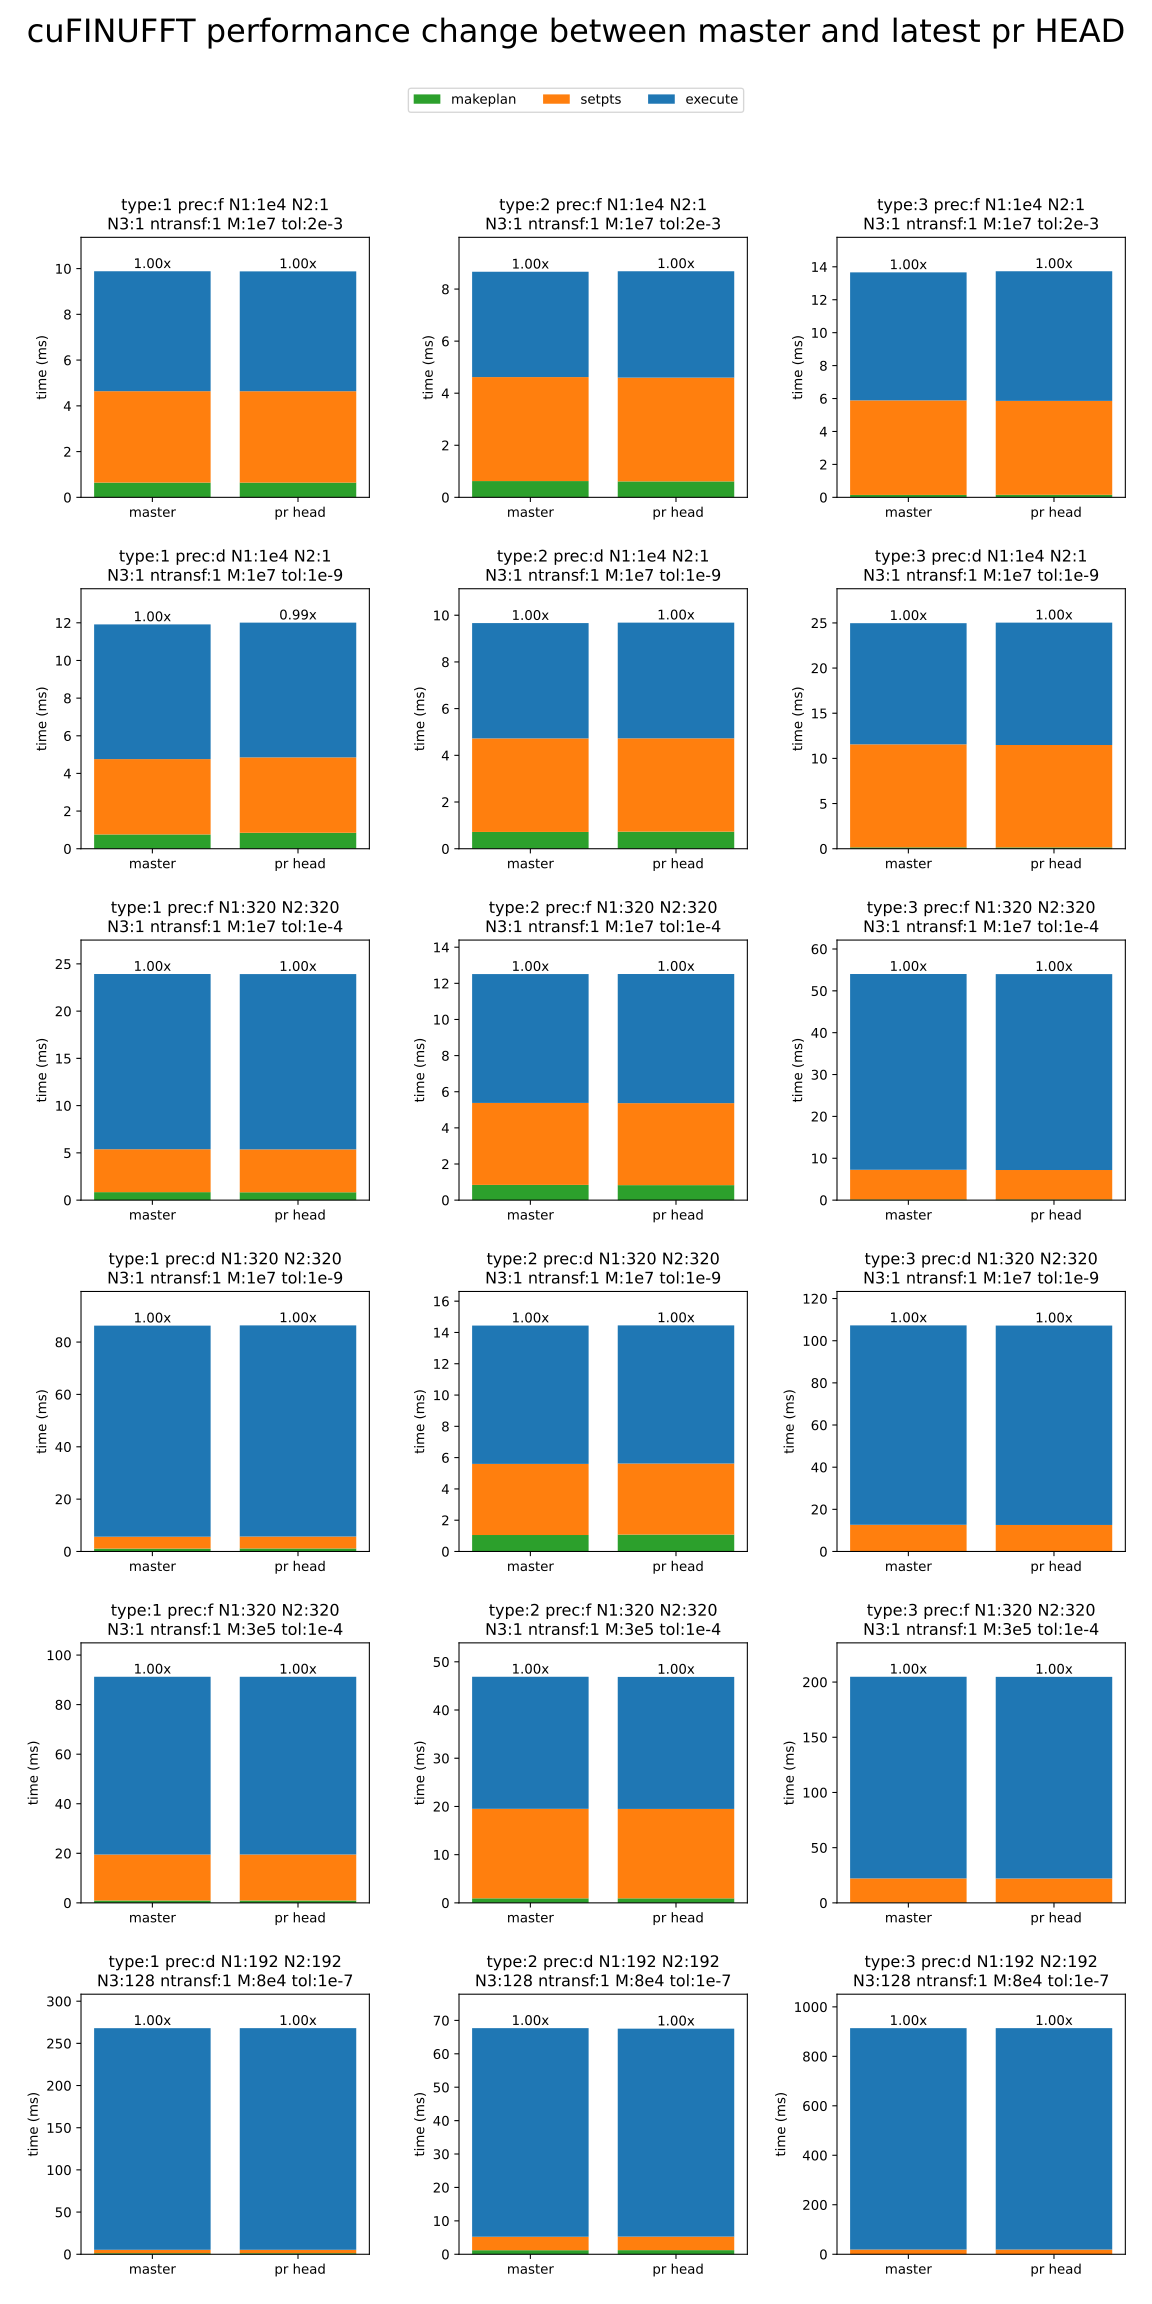
Tesla V100-PCIE-16GB, 7.0, 16384 MiB, 580.159.03. Baseline master 9810998.

cuperftest plot

cuFINUFFT perftest plot

how the benchmarks are measured

Ratio is master/PR-head time: >1 means the PR is faster. Time is makeplan plus setpts plus execute on both halves; the GPU host transfers stage the harness's own test data, so no library change moves them and they are left out. Each case runs 8 rounds with the two binaries interleaved and their order alternating; each arm is tabulated at its median round and the band spans the per-round ratios. A ratio is bold where the band excludes 1.00, which is where the run resolved a change; every other row resolved nothing. Every option a caller may leave alone is left alone (sorting, upsampling factor, kernel choice), so a change to one of finufft's heuristics shows up here as the change in time it causes. The thread count is the exception: a case is defined by the count it runs at.

per-case timings
case master (ms) PR head (ms) ratio band
type:1 prec:f N1:1e4 N2:1 N3:1 ntransf:1 M:1e7 tol:2e-3 9.88 9.88 1.00x 0.96-1.01
type:2 prec:f N1:1e4 N2:1 N3:1 ntransf:1 M:1e7 tol:2e-3 8.67 8.68 1.00x 0.98-1.03
type:3 prec:f N1:1e4 N2:1 N3:1 ntransf:1 M:1e7 tol:2e-3 13.66 13.73 1.00x 0.90-1.09
type:1 prec:d N1:1e4 N2:1 N3:1 ntransf:1 M:1e7 tol:1e-9 11.92 12.01 0.99x 0.92-1.02
type:2 prec:d N1:1e4 N2:1 N3:1 ntransf:1 M:1e7 tol:1e-9 9.66 9.68 1.00x 0.97-1.03
type:3 prec:d N1:1e4 N2:1 N3:1 ntransf:1 M:1e7 tol:1e-9 24.97 25.03 1.00x 0.99-1.01
type:1 prec:f N1:320 N2:320 N3:1 ntransf:1 M:1e7 tol:1e-4 23.93 23.92 1.00x 0.99-1.00
type:2 prec:f N1:320 N2:320 N3:1 ntransf:1 M:1e7 tol:1e-4 12.51 12.52 1.00x 0.99-1.02
type:3 prec:f N1:320 N2:320 N3:1 ntransf:1 M:1e7 tol:1e-4 54.02 53.99 1.00x 1.00-1.00
type:1 prec:d N1:320 N2:320 N3:1 ntransf:1 M:1e7 tol:1e-9 86.28 86.37 1.00x 1.00-1.00
type:2 prec:d N1:320 N2:320 N3:1 ntransf:1 M:1e7 tol:1e-9 14.44 14.45 1.00x 0.99-1.01
type:3 prec:d N1:320 N2:320 N3:1 ntransf:1 M:1e7 tol:1e-9 107.27 107.19 1.00x 1.00-1.00
type:1 prec:f N1:320 N2:320 N3:1 ntransf:1 M:3e5 tol:1e-4 91.24 91.23 1.00x 1.00-1.00
type:2 prec:f N1:320 N2:320 N3:1 ntransf:1 M:3e5 tol:1e-4 46.90 46.87 1.00x 1.00-1.00
type:3 prec:f N1:320 N2:320 N3:1 ntransf:1 M:3e5 tol:1e-4 204.78 204.69 1.00x 1.00-1.00
type:1 prec:d N1:192 N2:192 N3:128 ntransf:1 M:8e4 tol:1e-7 268.01 268.05 1.00x 1.00-1.00
type:2 prec:d N1:192 N2:192 N3:128 ntransf:1 M:8e4 tol:1e-7 67.69 67.54 1.00x 1.00-1.00
type:3 prec:d N1:192 N2:192 N3:128 ntransf:1 M:8e4 tol:1e-7 913.95 914.00 1.00x 1.00-1.00
device and toolkit

Device: Tesla V100-PCIE-16GB, 7.0, 16384 MiB, 580.159.03

nvcc: NVIDIA (R) Cuda compiler driver
Copyright (c) 2005-2025 NVIDIA Corporation
Built on Fri_Feb_21_20:23:50_PST_2025
Cuda compilation tools, release 12.8, V12.8.93
Build cuda_12.8.r12.8/compiler.35583870_0
cuperftest commands
master/build/perftest/cuda/cuperftest --prec=f --N1=1e4 --N2=1 --N3=1 --ntransf=1 --M=1e7 --tol=2e-3 --type=1 --n_runs=5 --sort=1 --debug=0
master/build/perftest/cuda/cuperftest --prec=f --N1=1e4 --N2=1 --N3=1 --ntransf=1 --M=1e7 --tol=2e-3 --type=2 --n_runs=5 --sort=1 --debug=0
master/build/perftest/cuda/cuperftest --prec=f --N1=1e4 --N2=1 --N3=1 --ntransf=1 --M=1e7 --tol=2e-3 --type=3 --n_runs=5 --sort=1 --debug=0
master/build/perftest/cuda/cuperftest --prec=d --N1=1e4 --N2=1 --N3=1 --ntransf=1 --M=1e7 --tol=1e-9 --type=1 --n_runs=5 --sort=1 --debug=0
master/build/perftest/cuda/cuperftest --prec=d --N1=1e4 --N2=1 --N3=1 --ntransf=1 --M=1e7 --tol=1e-9 --type=2 --n_runs=5 --sort=1 --debug=0
master/build/perftest/cuda/cuperftest --prec=d --N1=1e4 --N2=1 --N3=1 --ntransf=1 --M=1e7 --tol=1e-9 --type=3 --n_runs=5 --sort=1 --debug=0
master/build/perftest/cuda/cuperftest --prec=f --N1=320 --N2=320 --N3=1 --ntransf=1 --M=1e7 --tol=1e-4 --type=1 --n_runs=5 --sort=1 --debug=0
master/build/perftest/cuda/cuperftest --prec=f --N1=320 --N2=320 --N3=1 --ntransf=1 --M=1e7 --tol=1e-4 --type=2 --n_runs=5 --sort=1 --debug=0
master/build/perftest/cuda/cuperftest --prec=f --N1=320 --N2=320 --N3=1 --ntransf=1 --M=1e7 --tol=1e-4 --type=3 --n_runs=5 --sort=1 --debug=0
master/build/perftest/cuda/cuperftest --prec=d --N1=320 --N2=320 --N3=1 --ntransf=1 --M=1e7 --tol=1e-9 --type=1 --n_runs=5 --sort=1 --debug=0
master/build/perftest/cuda/cuperftest --prec=d --N1=320 --N2=320 --N3=1 --ntransf=1 --M=1e7 --tol=1e-9 --type=2 --n_runs=5 --sort=1 --debug=0
master/build/perftest/cuda/cuperftest --prec=d --N1=320 --N2=320 --N3=1 --ntransf=1 --M=1e7 --tol=1e-9 --type=3 --n_runs=5 --sort=1 --debug=0
master/build/perftest/cuda/cuperftest --prec=f --N1=320 --N2=320 --N3=1 --ntransf=1 --M=37200000 --tol=1e-4 --type=1 --n_runs=5 --sort=1 --debug=0
master/build/perftest/cuda/cuperftest --prec=f --N1=320 --N2=320 --N3=1 --ntransf=1 --M=37200000 --tol=1e-4 --type=2 --n_runs=5 --sort=1 --debug=0
master/build/perftest/cuda/cuperftest --prec=f --N1=320 --N2=320 --N3=1 --ntransf=1 --M=37200000 --tol=1e-4 --type=3 --n_runs=5 --sort=1 --debug=0
master/build/perftest/cuda/cuperftest --prec=d --N1=192 --N2=192 --N3=128 --ntransf=1 --M=9920000 --tol=1e-7 --type=1 --n_runs=5 --sort=1 --debug=0
master/build/perftest/cuda/cuperftest --prec=d --N1=192 --N2=192 --N3=128 --ntransf=1 --M=9920000 --tol=1e-7 --type=2 --n_runs=5 --sort=1 --debug=0
master/build/perftest/cuda/cuperftest --prec=d --N1=192 --N2=192 --N3=128 --ntransf=1 --M=9920000 --tol=1e-7 --type=3 --n_runs=5 --sort=1 --debug=0

Sign up for free to join this conversation on GitHub. Already have an account? Sign in to comment

Labels

None yet

Projects

None yet

Development

Successfully merging this pull request may close these issues.

5 participants