MechaCar requires analysis of data to help identify production troubles. Utilizing RStudio the task is to create statistical analysis of miles per gallon data and suspension coil data. Multiple linear regresion is used to predict MPG of MechaCar Prototypes. Summary statistics are used on large data sets to find mean, median, variance, and standard deviation for PSI data on suspension coils. T-tests are used to determine PSI statistical variances between production lots of suspension coils. Finally, additional statistical studies are suggested to help MechaCar compare their vehicles with competors vehicles.
RStudio
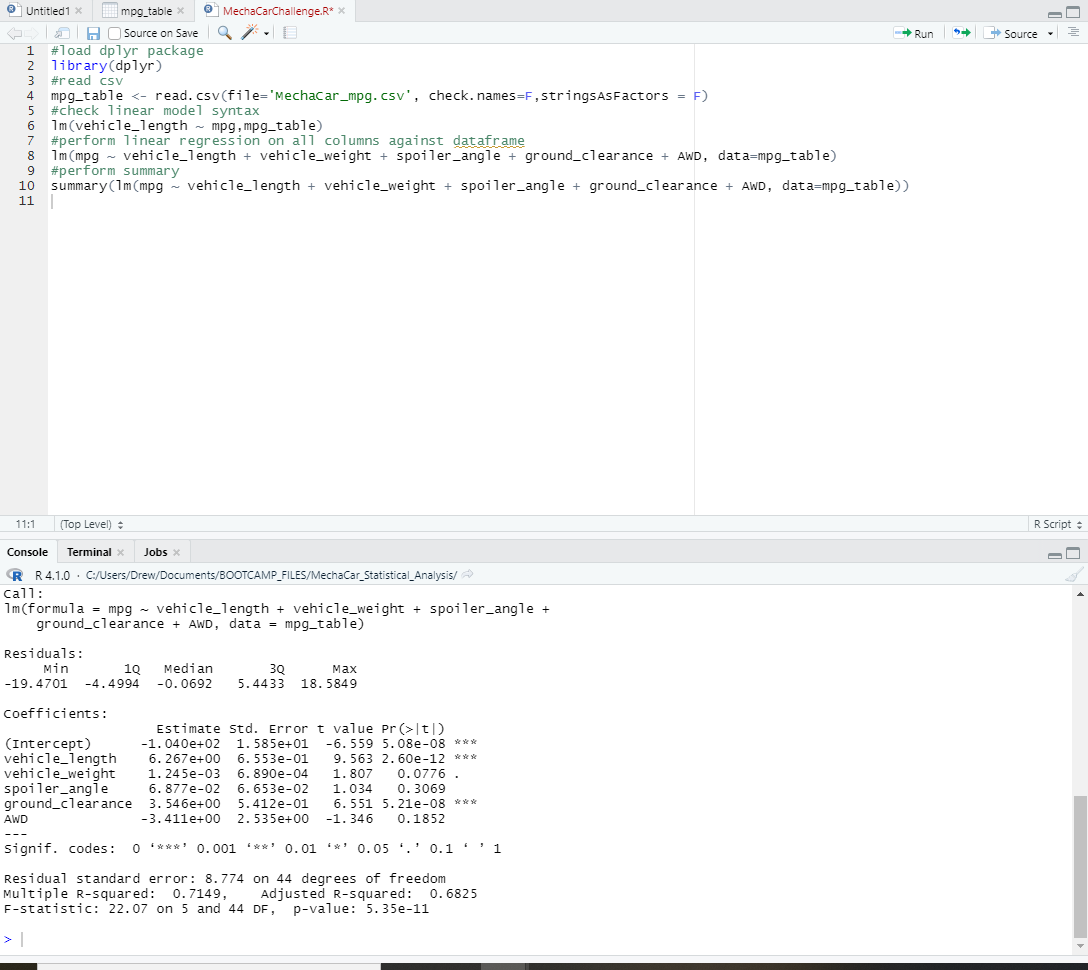
• Which variables/coefficients provided a non-random amount of variance to the mpg values in the dataset? Reviewing the summary function output, the Pr(>|t|) reveals the likelihood of a variable to contribute a random variance to the linear model. Values close to 0 are those with the lowest likelihood of variance and impact mpg in the data set the most. The variables in this data set that created non-random variance are vehicle_length and ground_clearance.
• Is the slope of the linear model considered to be zero? Why or why not? No, the slope is not considered to be zero. All columns in the data set represent variables of measurement that were tested against the mpg readings. All showed some difference between the variable and the mpg, meaning all variables impact the mpg of the vehicle with which they are installed. The level of that impact and the probability of random impacts are predicted in the linear regression model. This is proven by the calculated p value of 5.35e-11 showing an extreme significance in the model.
• Does this linear model predict mpg of MechaCar prototypes effectively? Why or why not? With the available data, the linear model predicts mpg of MechaCar prototypes effectively. This is proven by the p-value of 5.35e-11. Removing some variables from the linear model would aid in the accuracy even more. Spoiler_angle and AWD have high p values, indicating any change in their value would have minimal affect on mpg.
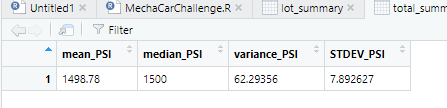
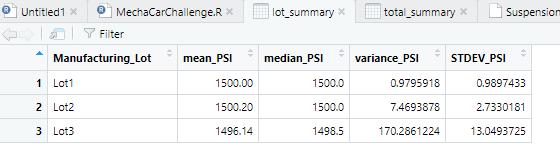
• The design specifications for the MechaCar suspension coils dictate that the variance of the suspension coils must not exceed 100 pounds per square inch. Does the current manufacturing data meet this design specification for all manufacturing lots in total and each lot individually? Why or why not? The total summary results show that the variance between all manufactured suspension coils is less than the design specifications of 100psi. However, the data analyzed for each Manufacturing Lot of suspension coils does not agree. Lot 1 and Lot 2 both fall within design specifications. However, Lot 3 has a variance of PSI outside of allowable tolerance. The standard deviation of this lot indicates that there are outliers from the required specifications. Lot 3 should be rejected.
Total Summary of Suspension Coils
Summary by Lot Number of Suspension Coils
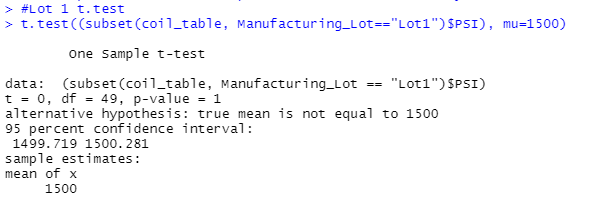
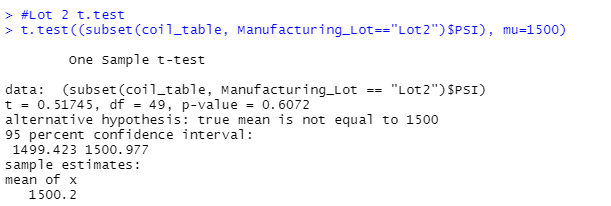
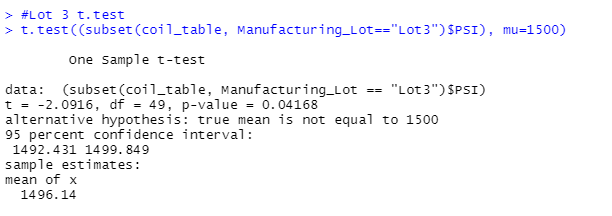
The T-tests on each lot were performed to find statistical differences from the mean. Lot 1 and Lot 2 do not show any meaningful statistical differences from the mean. Lot 3, however, shows a much higher statistical difference as indicated by the P-value calculated to 0.04. As the value moves further from 1, the higher the statistical difference from the mean.
Lot1 T-Test
Lot2 T-Test
Lot3 T-Test
Consumers use many factors in determining their next purchase. Some of the major factors include horsepower, cost, and fuel efficiency. MechaCar would need to collect data on competitors’ vehicles to see if, and how much, they differ from each other. The null hypothesis would state that the competition is not different from MechaCar. Whereas the alternative hypothesis would state that the competition is different from MechaCar. Utilizing a t-test to compare MechaCar population summary statistics to that of the competition population summary statistics to identify statistical differences.
Simply identifying if the competition is different limits quality decision making for MechaCar. For example, a car with higher horsepower would most likely have lower fuel efficiency. Also, a car with lower cost may also have lower horsepower. A better analysis would utilize ANOVA testing to test multiple variables for variance. The limiter with this analysis is that all data would need to be within the same data frame. Creating a comparison of horsepower and cost and/or how power and fuel efficiency could then be added to a data frame containing the same data from competitors. Then they could be statistically compared against each other.