日本語のREADMEはこちらです: README.ja.md
A lightweight JavaScript library for easily creating interactive maps using Leaflet.js and map tiles from the Geospatial Information Authority of Japan (GSI).
- Simple & Lightweight: Quickly embed interactive maps with just a few lines of code.
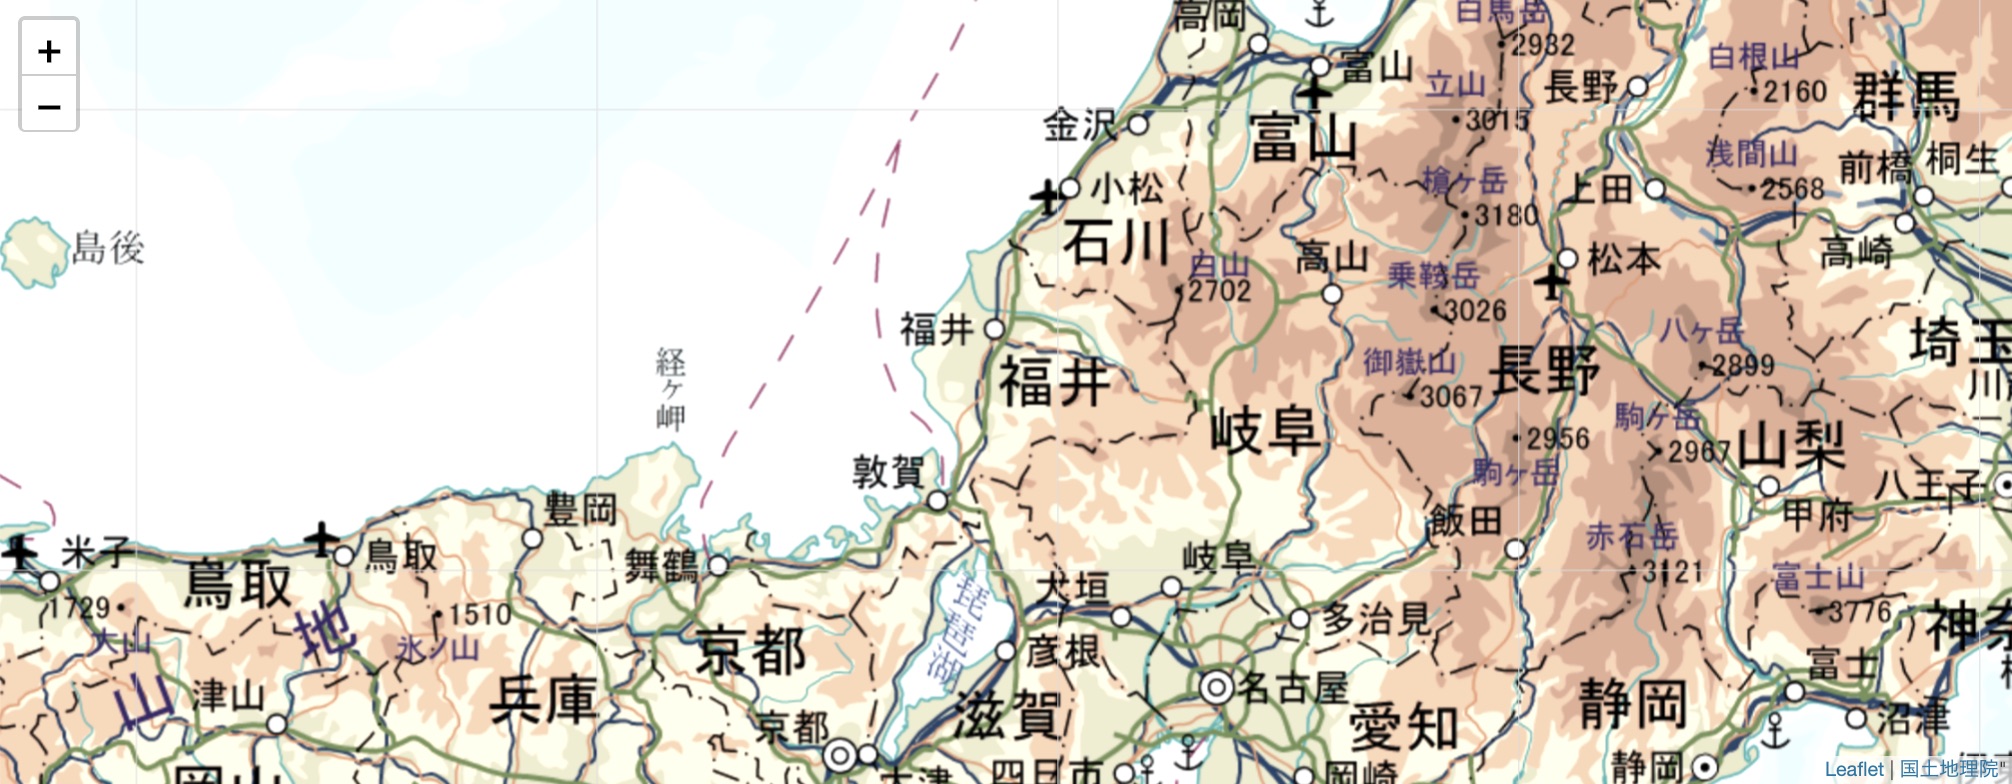
- GSI Maps: Utilizes beautiful and detailed map tiles from the Geospatial Information Authority of Japan.
- Easy Markers: Add custom icons and pop-up markers with a single helper function.
- Open Data Ready: Includes a helper (
sparql.js) to fetch and display data from SPARQL endpoints. - Modern JavaScript: Also available as an ES Module (
egmap.mjs).
First, create a <div> for your map. Then, include the CSS and JavaScript files for Leaflet and egmapjs.
<!-- 1. Create a map container -->
<div id="mapid" style="height: 400px;"></div>

<!-- 2. Include Leaflet.js -->
<link rel="stylesheet" href="https://unpkg.com/leaflet@1.4.0/dist/leaflet.css"/>
<script src="https://unpkg.com/leaflet@1.4.0/dist/leaflet.js"></script>

<!-- 3. Include egmapjs -->
<script src="https://code4fukui.github.io/egmapjs/egmap.js"></script>Use JavaScript to initialize the map, set its view, and add markers.
// Initialize the map in the 'mapid' div
const map = initMap('mapid');

// Set the view to Sabae Station with a zoom level of 16
map.setZoom(16);
map.panTo([35.943560, 136.188917]);

// Add a custom icon for "Hana道場"
map.addIcon(
  35.944571,          // Latitude
  136.186228,          // Longitude
  "Hana道場",          // Popup text
  "icon/hanadojo.png", // Icon image URL (optional)
  64                   // Icon width (optional)
);You can easily plot open data on the map using the included sparql.js helper.
-
Include the script in your HTML:
<script src="https://code4fukui.github.io/egmapjs/sparql.js"></script>
-
Write a SPARQL query and use
querySPARQLto add the results to the map:// SPARQL query to find public WiFi spots const query = ` PREFIX rdfs: <http://www.w3.org/2000/01/rdf-schema#> PREFIX geo: <http://www.w3.org/2003/01/geo/wgs84_pos#> SELECT ?name ?lat ?lng WHERE { ?uri a <http://purl.org/jrrk#PublicWIFI>; rdfs:label ?name; geo:lat ?lat; geo:long ?lng. } LIMIT 100`; querySPARQL(query, (data) => { const items = data.results.bindings; for (const item of items) { map.addIcon(item.lat.value, item.lng.value, item.name.value); } });
For modern web development, you can use the ES Module version.
import { initMap, L } from "https://code4fukui.github.io/egmapjs/egmap.mjs";

const map = initMap('mapid');
map.setView([35.94, 136.18], 15);
map.addIcon(35.944, 136.186, "Hana道場");Explore our comprehensive tutorials and live demos to see what's possible with egmapjs.
- View All Tutorials: Covers basic maps, SPARQL, GPS, routing, and more.
- Live Demos:
This library uses map tiles from the Geospatial Information Authority of Japan (GSI). Please ensure proper attribution is maintained.
- Blog Post: 簡単で無料で活用できる地図API、leafletjs x 地理院地図 (in Japanese)
This project is licensed under the Creative Commons Attribution 4.0 International License (CC BY 4.0).