



Celldega is a toolkit for exploring spatial and single-cell data through linked, GPU-accelerated visualizations. Explore tissue images, cells, transcripts, and neighborhoods with Landscape; compare expression patterns with Clustergram heatmaps and dot plots; and interpret gene sets with Enrich. Other views include cell portraits, composition charts, and 3D cell and neighborhood clouds.
Use Celldega in Jupyter notebooks or as a standalone JavaScript library. For desktop viewing of prepared data, try Celldega-App. Download the latest desktop build.
Getting started · Visualizations · Interactive gallery · Tutorial notebooks · Changelog
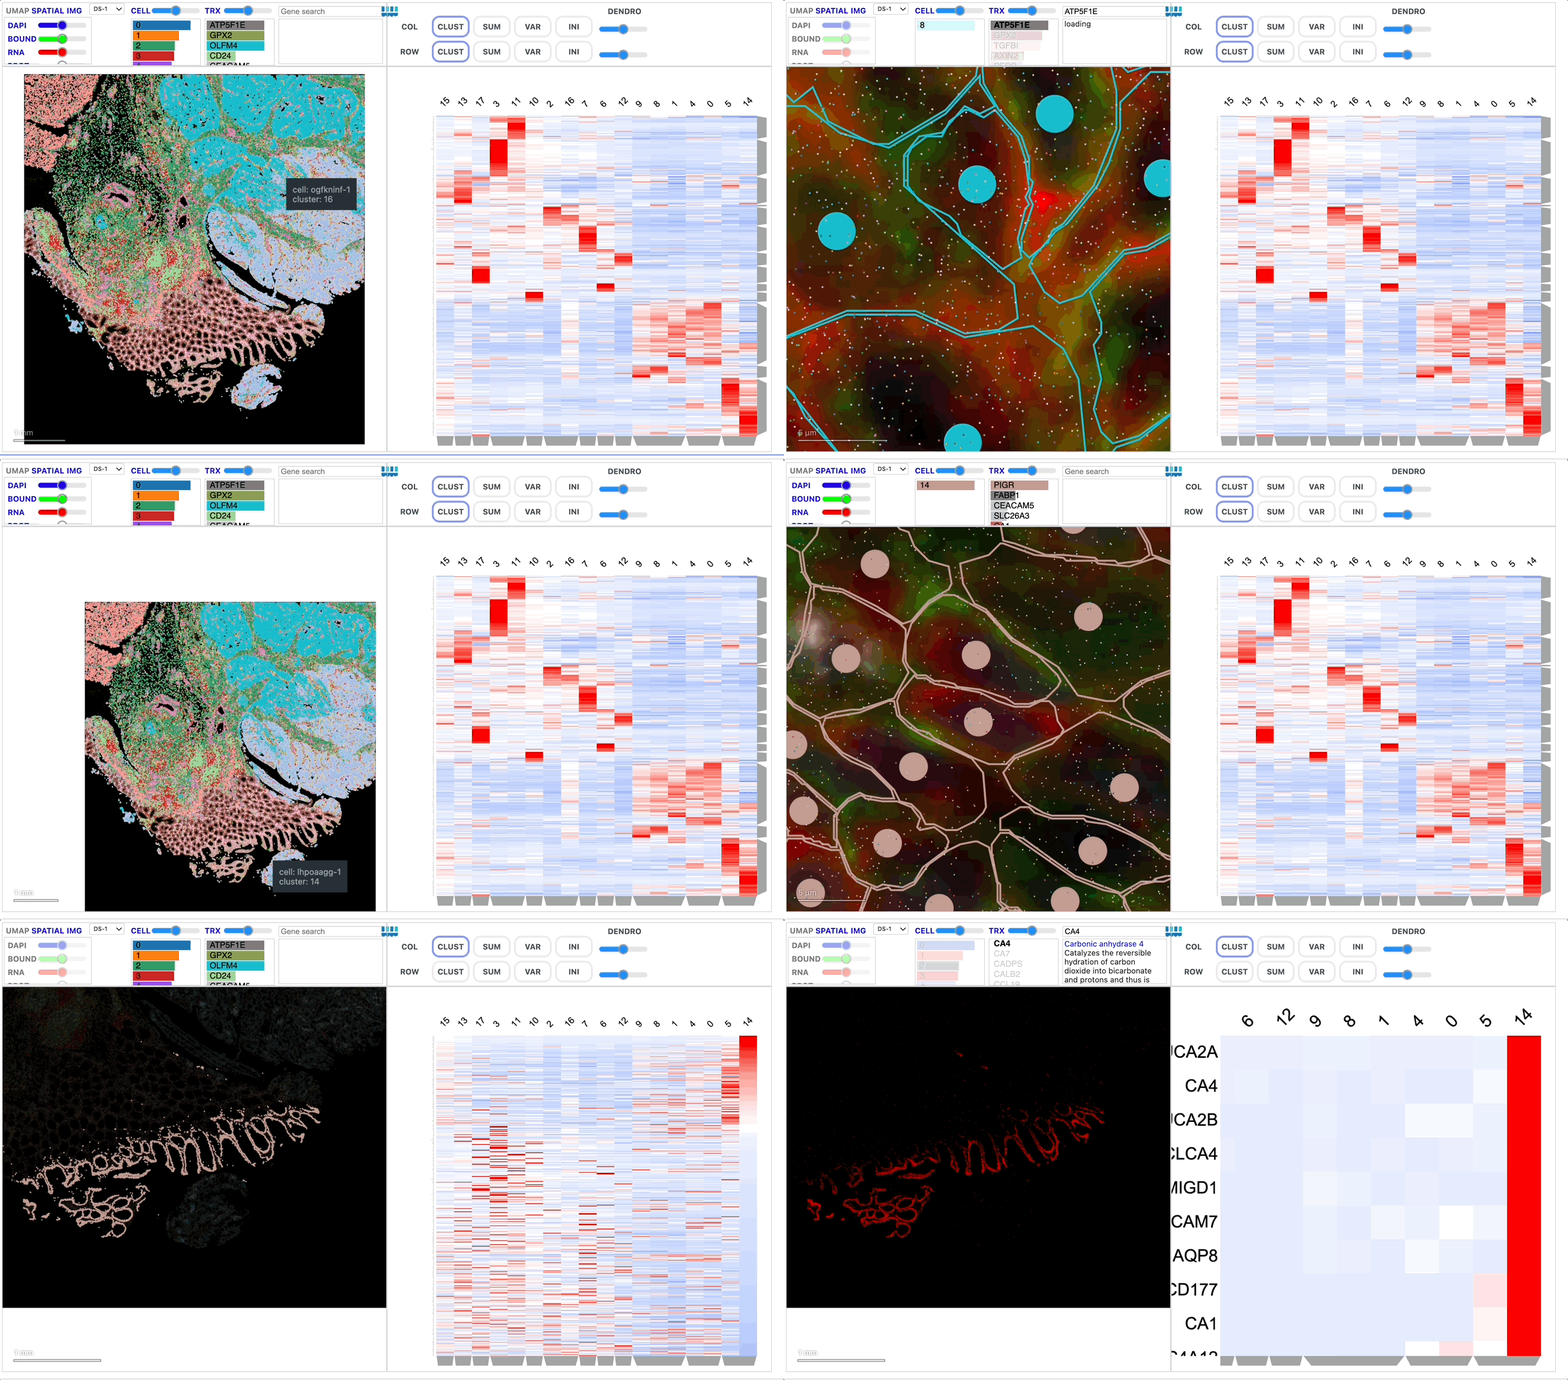
Celldega supports Python 3.11 and 3.12. Install it in your notebook's environment:
pip install celldegaRun this in a notebook to explore a prepared Xenium human skin dataset:
import celldega as dega

base_url = (
    "https://raw.githubusercontent.com/broadinstitute/"
    "celldega_Xenium_Prime_Human_Skin_FFPE_outs/main/"
    "Xenium_Prime_Human_Skin_FFPE_outs"
)

landscape = dega.viz.Landscape(
    base_url=base_url,
    ini_zoom=-4.5,
    ini_x=6000,
    ini_y=8000,
    height=700,
    width=600,
)
landscape
Follow the linked Landscape–Clustergram–Enrich guide to connect tissue or UMAP views with expression patterns and enrichment results. The installation guide covers optional analysis and image-preprocessing dependencies.
For a web application:
npm install celldegaSee the JavaScript quick start for standalone and linked views.
- Getting Started: installation, usage options, and data formats.
- Visualizations: widget guides and linked workflows.
- Gallery: interactive examples across datasets and technologies.
- Example Notebooks: complete analysis and visualization workflows.
- Python API and JavaScript API: reference documentation.
See Contributing for prerequisites, setup, testing, and
publishing documentation notebooks. The setup script uses uv to create a
Python environment and installs the development tools:
git clone https://github.com/broadinstitute/celldega.git
cd celldega
bash scripts/setup.sh
source dega/bin/activate
npm run dev
npm run dev watches and rebuilds the JavaScript widget bundle. Open
jupyter lab notebooks/ in another terminal to work with the development
notebooks. Maintained documentation tutorials live under docs/examples/.
| Path | Contents |
|---|---|
src/celldega/ |
Python package |
js/ |
JavaScript widgets and visualizations |
docs/ |
Documentation, gallery, and published tutorial notebooks |
notebooks/ |
Development and analysis notebooks |
celldega_js_examples/ |
Standalone JavaScript examples |
tests/ and js/__tests__/ |
Python and JavaScript tests |
scripts/ |
Setup, testing, and development utilities |
Use GitHub Discussions for questions, or open an issue to report a bug or request a feature. Contributions to the code, documentation, and examples are welcome; start with the contributing guide.
If Celldega helps your research, please cite our preprint: Celldega: Integrated Toolkit for Visualization and Analysis of Spatial Data.
Celldega is developed by the Spatial Technology Platform at the Broad Institute of MIT and Harvard. See LICENSE.txt for license terms.