
Grafana data source plugin for SLayer — Motley's open-source, agent-first semantic layer.
Build dashboards over the same structured query DSL your AI agents use over MCP, against any of SLayer's supported databases — Postgres, MySQL, ClickHouse, Snowflake, BigQuery, DuckDB, SQLite, and more.
Status: beta. PRs and issues welcome.
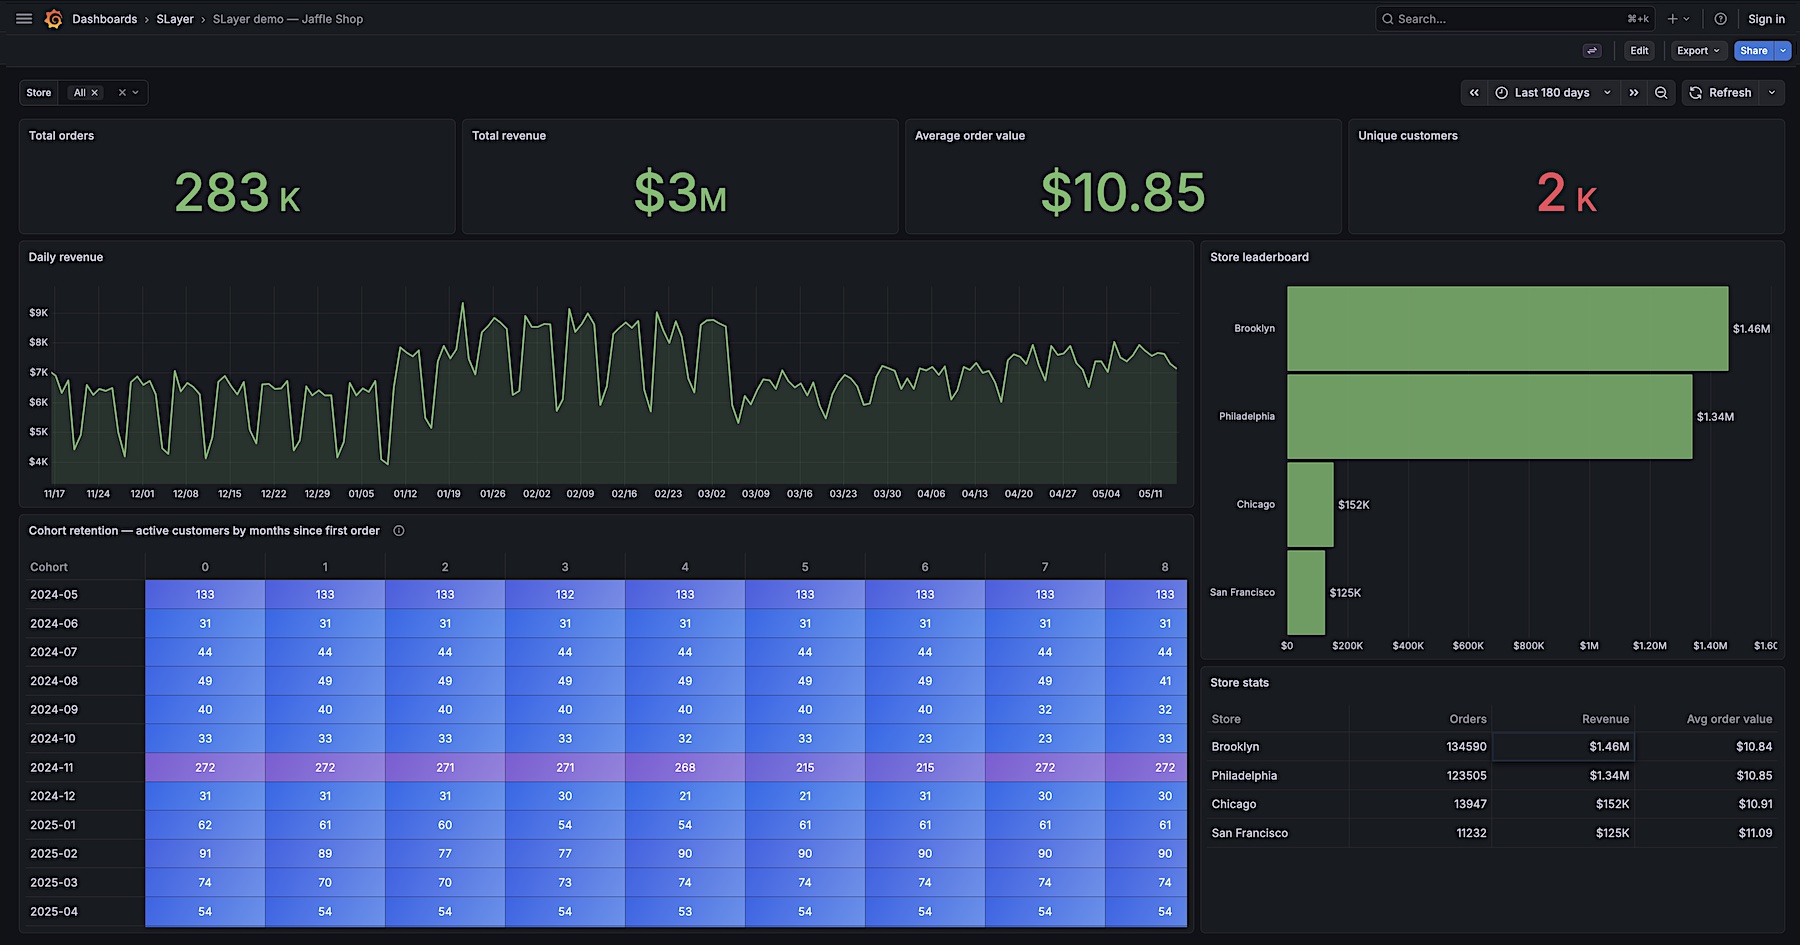
The only thing you need on your machine is Docker Compose:
git clone https://github.com/MotleyAI/grafana-slayer-datasource
cd grafana-slayer-datasource
docker compose up
Open http://localhost:3000/d/slayer-jaffle-demo/: Dashboards → SLayer → Jaffle Shop. Everything builds inside Docker — no Node, Go, or Python on your host. First run takes ~5 minutes (frontend + backend + Grafana, hermetic multi-stage build); subsequent boots take seconds. A local SLayer instance with the bundled Jaffle Shop demo data on DuckDB comes up alongside Grafana.
SLayer sits between your database and your AI agents (and dashboards, scripts, internal tools). Instead of writing raw SQL, you describe what you want — measures, dimensions, filters — and SLayer compiles it to the right SQL dialect, handling joins, time arithmetic, and per-engine quirks.
A query like
{
  "source_model": "orders",
  "measures": ["cumsum(revenue:sum)", "change_pct(revenue:sum)"],
  "time_dimensions": [{"dimension": "ordered_at", "granularity": "month"}]
}
produces "month-on-month % change in cumulative revenue" — no one writes window functions. SLayer's DSL supports measure formulas, time shifts, joined dimensions, multi-stage queries, queries-as-models, and a lot more.
- Auto-ingestion of your schema — introspects tables and foreign keys, generates models with explicit join metadata.
- Query-time aggregations — pick
:sum/:avg/:count_distinctper query, not at model definition time. - Composable transforms —
cumsum,time_shift,change_pct,lag,lead,rank,percentile, more. - Dialect-aware compilation — same query, correct SQL for every backend.
- Saved memories — agents and humans can record natural-language notes tied to specific entities; SLayer surfaces them on future queries.
- Schema-drift detection — when the live database diverges from a saved model, SLayer flags it instead of generating broken SQL.
| Consumer | Surface | What it does |
|---|---|---|
| Humans | This Grafana plugin | Builds dashboards on SLayer models — query editor with form + JSON modes |
| AI agents 🤖 | SLayer's MCP server | Tools to introspect models, run queries, save memories, ingest new datasources |
| Code | REST, Python, CLI | Same models, same DSL, embeddable as a Python library or run as a server |
That's the central thesis: model your data once, query it from anywhere using the same vocabulary. No more "SQL written by humans" vs "SQL written by agents" divergence.
Two MCP servers, two halves of the loop. Agents read with one and write with the other.
1. SLayer's MCP — query and model the data. Introspect models, run queries, save memories, ingest new datasources. Already shipped with SLayer. Attach with one line:
claude mcp add slayer --transport sse --url http://localhost:5143/mcp/sseSee SLayer's MCP docs for the full tool list.
2. SLayer-Grafana's MCP — author the dashboards. This plugin hosts its own MCP server inside Grafana itself — served at the datasource's resource path. Three tools:
| Tool | What it does |
|---|---|
list_dashboards |
Find dashboards by name; returns uid/title/tags/URL. |
inspect_dashboard |
Read the panels already on a dashboard (id, type, title, gridPos, target query). |
add_panel_to_dashboard |
Append a SLayer-backed panel: pass a SlayerQuery JSON, a title, and (optionally) a panel type (table / stat / timeseries / barchart). Panel lands full-width at the bottom; user can re-arrange in Grafana's editor afterwards. |
Attach with one line — no separate binary, no extra container, just an HTTP URL:
claude mcp add slayer-grafana --transport http \
  --url http://localhost:3000/api/datasources/uid/slayer/resources/mcp
Auth flows through Grafana automatically — agent requests inherit whatever Grafana auth you use (session, service-account token, anonymous). For real installs:
claude mcp add slayer-grafana --transport http \
  --url https://grafana.example.com/api/datasources/uid/<your-slayer-ds>/resources/mcp \
  --header "Authorization: Bearer $GRAFANA_TOKEN"
For dashboard write operations (creating panels), the plugin uses an outbound Grafana token configured on the SLayer datasource itself — see Grafana service-account token in the datasource config page. The bundled demo works without one because anonymous Admin auth is enabled.
Now your agent has both MCPs: it queries SLayer to figure out the right structure, then writes a Grafana panel that ships that query. End-to-end natural-language dashboards.
The Go backend is a thin proxy: it forwards your panel's query payload to SLayer's POST /query, converts the response into a Grafana data frame, sends it back. Your data never lands in the plugin's storage — SLayer talks to your DB directly.
A single Grafana data source instance points at a single SLayer instance; SLayer's internal datasource selection (which Postgres? which ClickHouse?) is per-query, exposed in the query editor.
Three quality-of-life features the plugin adds on top of the raw REST call:
- Time-range auto-injection. Grafana's dashboard time range is auto-populated as
{__from},{__to},{__from_ms},{__to_ms},{__interval_ms}variables on every query — you can reference them directly in filters (ordered_at >= '{__from}'). If your query declares atime_dimensionand no filter mentions the macros, a default time filter is auto-added. - Template variables. Dashboard dropdown variables can be populated from a SlayerQuery: write the JSON in the variable definition (e.g.
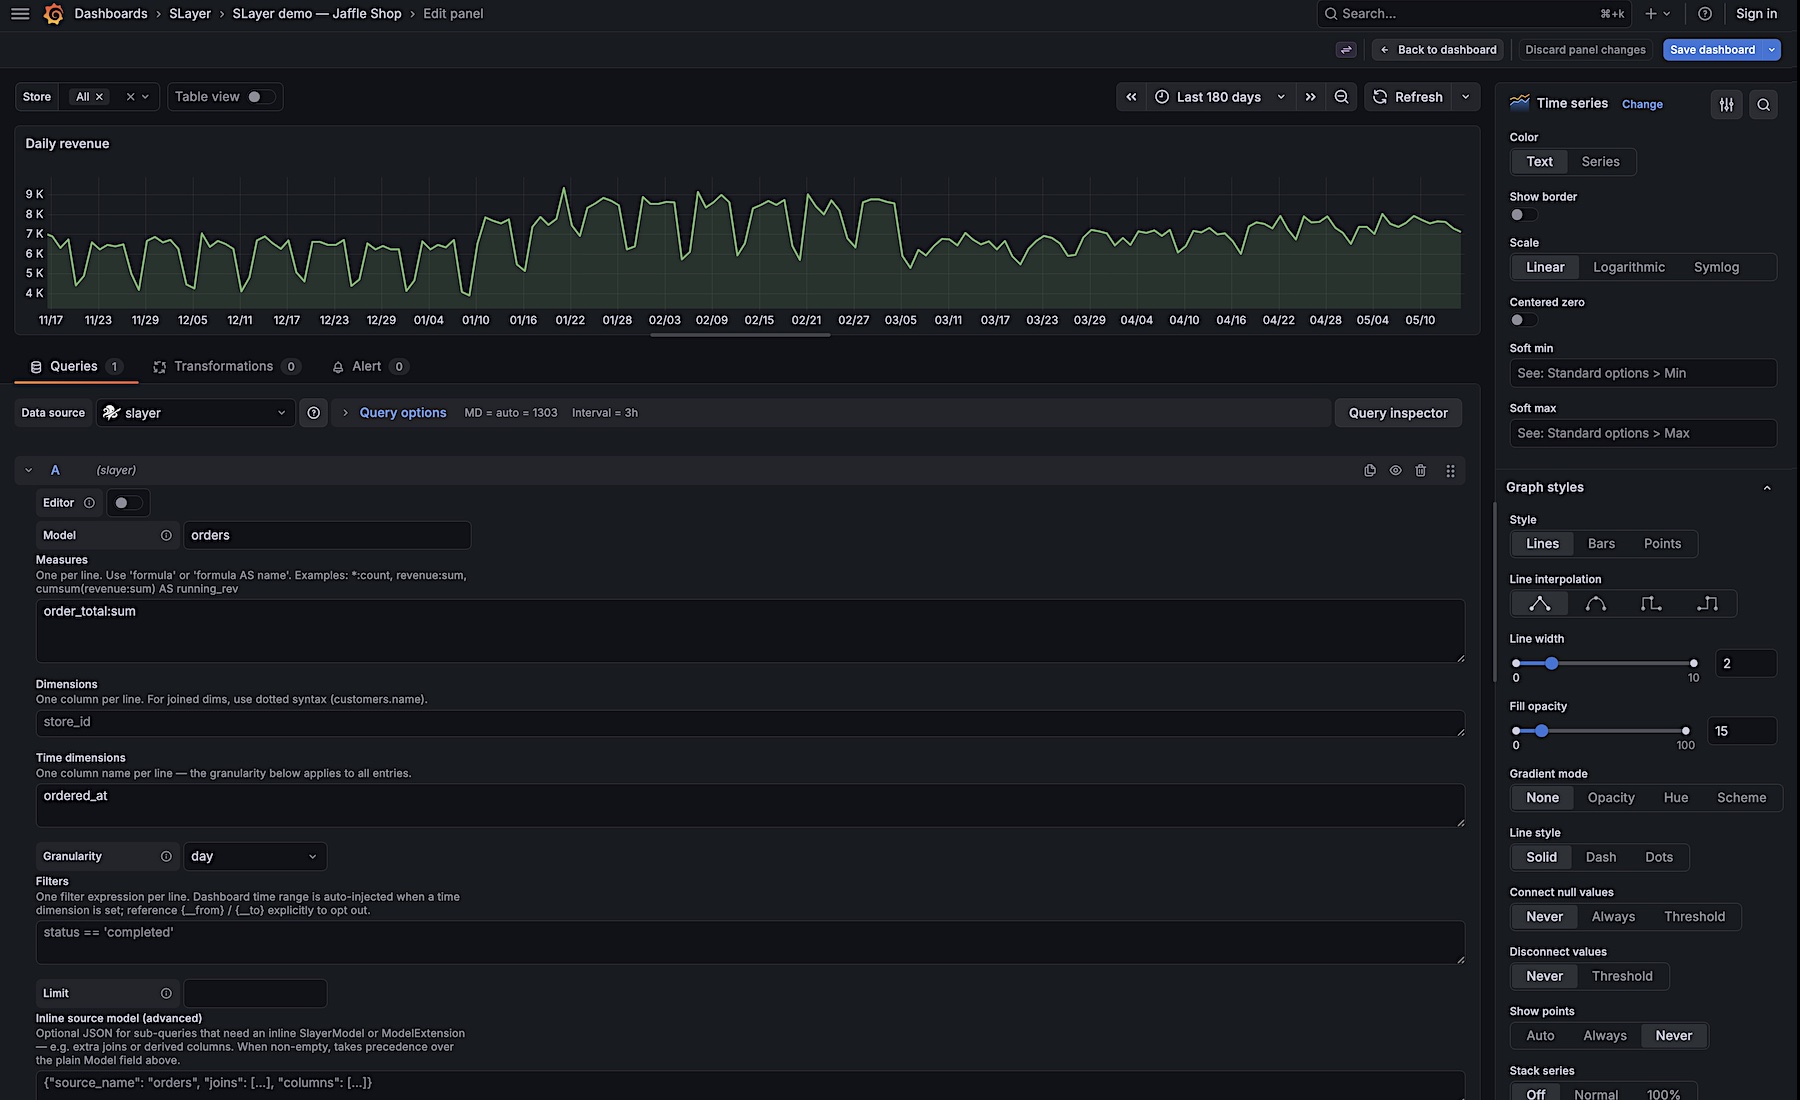
{"source_model":"orders","dimensions":[{"name":"store_id"}]}) and the plugin'smetricFindQueryprojects the first column into dropdown options. - Form + JSON query editor. Common queries are built with a form (model, measures, dimensions, time dim + granularity, filters); the "JSON" toggle lets power users drop into the raw
SlayerQueryfor the full DSL.
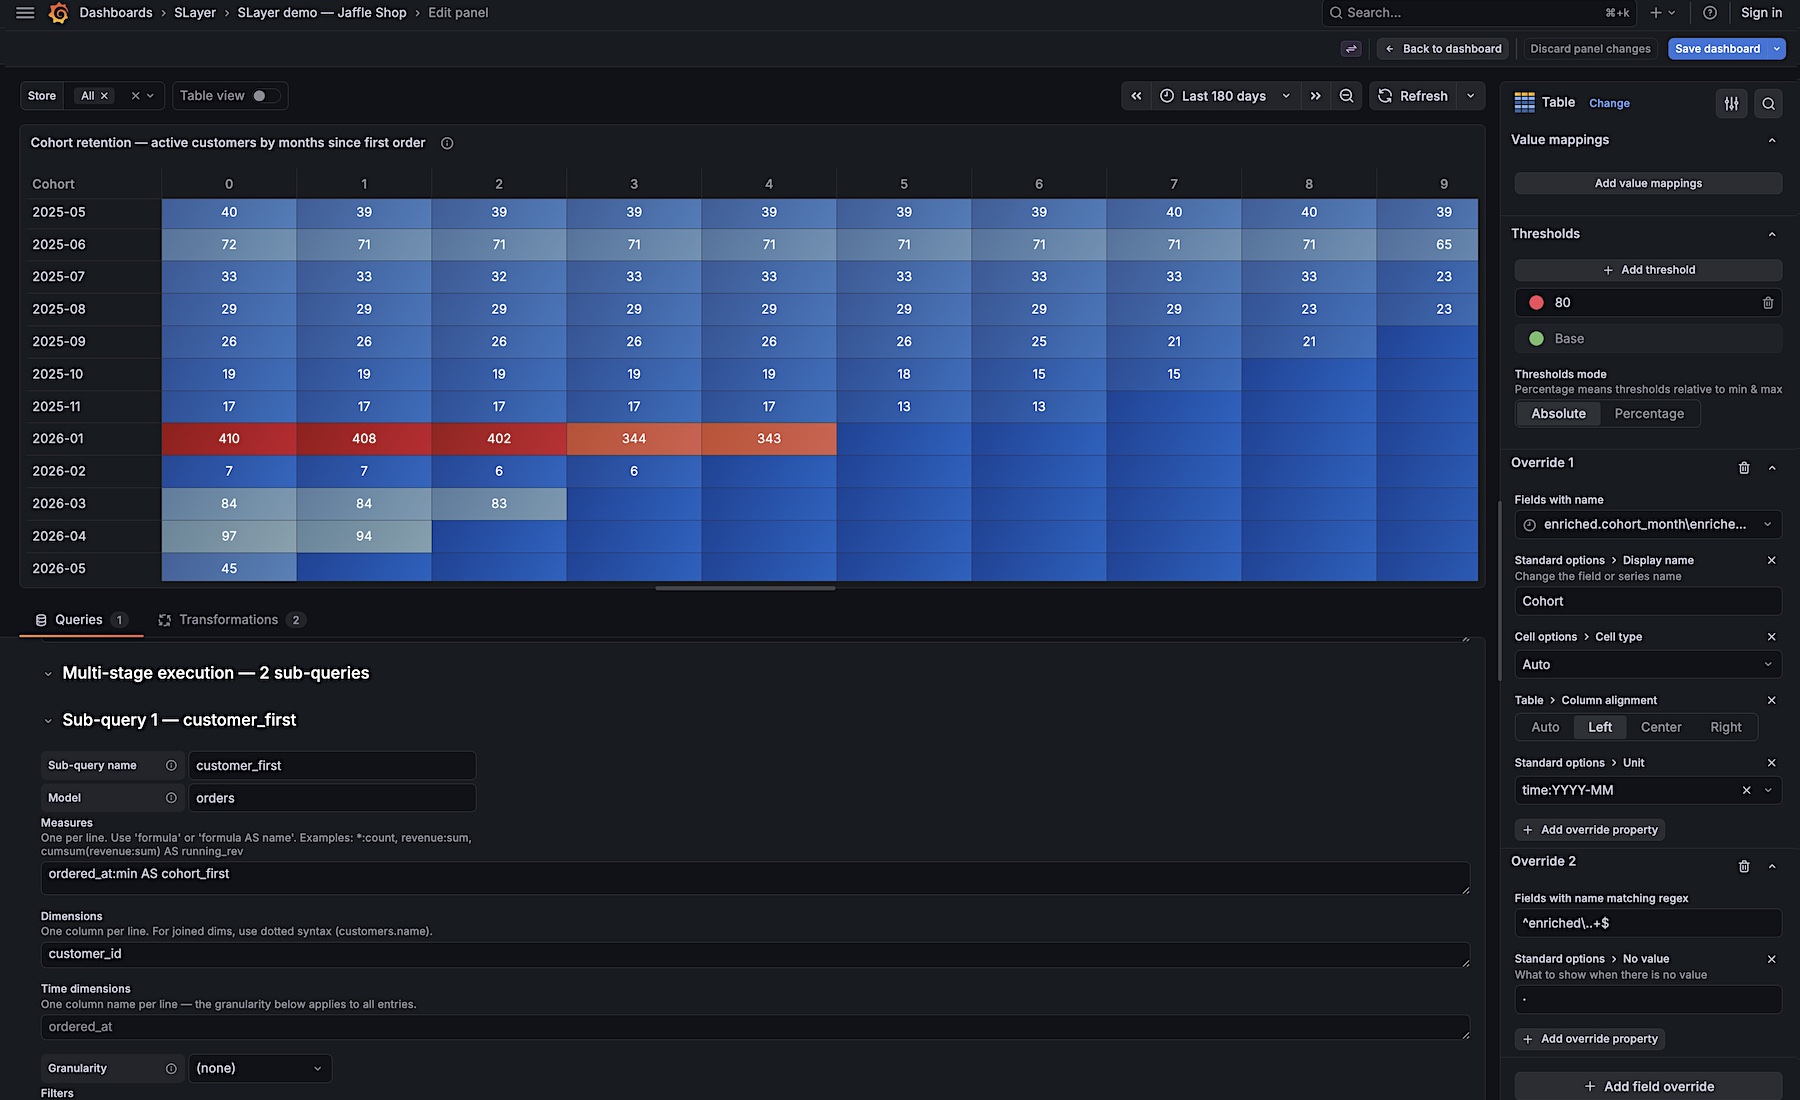
Cohort analysis, period-over-period comparisons, queries-as-models — anything that needs an intermediate aggregation to feed a final one — is a first-class shape in the SLayer DSL. The plugin's editor exposes the full DAG inline: a form for the outer query plus a collapsible list of named sub-queries, each editable with the same controls (no JSON wrangling required).
The cohort retention table in the demo dashboard is built this way — one sub-query derives each customer's first-order month, another joins orders back and computes the month-since-cohort offset, the outer query counts active customers per (cohort, period). Three composable SlayerQuery stages, one panel, the same DSL your AI agents use over MCP.
- Run SLayer pointed at your database —
pip install motley-slayer && slayer serve, then add a data source and ingest models. Or use the MCP tools to have your agent do it for you. - Add a SLayer data source in Grafana — paste the URL (e.g.
http://localhost:5143). The "Save & test" button calls SLayer's/healthto verify connectivity. - Build dashboards. Model names autocomplete from
GET /models; the query editor handles measures, dimensions, time dimensions with granularity, and filters; advanced users drop into JSON for the full DSL.
Tooling, build, test, dev-container, roadmap — see CONTRIBUTING.md.