- Introduction
- Preparing MSD data
- Applying the MSD analysis
- Choosing a diffusion window
- Estimating diffusion and checking reliability
- Practical workflow
- Appendix A: MSD estimator and algorithms
- Appendix B: Preparing equilibrium trajectories
- Appendix C: Synthetic motion patterns
- References
The mean-squared displacement (MSD) connects particle motion to long-time spreading:
Here
For drift-free isotropic diffusion in three dimensions, Einstein's relation is
where
Equation (2) is a long-time limit. At short lag times, velocity persistence can produce ballistic growth,
The local logarithmic slope

Figure 1. MSD regimes. (a) A single smooth MSD curve showing different lag-time regions within one trajectory. (b) Its local logarithmic slope,
A further complication is that a linear long-time MSD need not extrapolate through the origin. For a normalized displacement probability density
When the boundary terms vanish, integration by parts yields
If this constant slope applies only after a crossover time
Thus
The same result follows from the velocity autocorrelation
If the velocity correlations decay sufficiently rapidly, the long-time form is
Short-time velocity memory can therefore contribute a constant to the late-time MSD while leaving its slope unchanged; finite-sampling and measurement effects may also contribute to the fitted intercept. Accordingly, the analysis below fits a free intercept, identifies a sustained linear window, and checks the stability and statistical adequacy of the resulting diffusion estimate. The paper by Bullerjahn, von Bülow, and Hummer provides the statistical benchmark for handling correlated, unequally precise MSD data and for quantifying uncertainty and goodness of fit.[6] This tutorial first uses slope, intercept, and window-stability diagnostics, then points to their framework for rigorous validation.
The subsequent analysis requires a pre-computed series of lag times
For reproducibility, record the ensemble conditions, system size, thermostat and barostat settings, sampling interval, production length, and treatment of drift and periodic boundaries. Retain independent runs or blocks for uncertainty estimation and state any finite-size correction, following the best-practice recommendations of Maginn et al.[7]
An MSD may be accumulated on the fly during a simulation, without storing the complete coordinate history. Before starting such a simulation, carefully verify the particle selection, reference frame, spatial components, treatment of periodic boundaries and drift, use of multiple time origins, and normalization at each lag. These choices define the observable and cannot be recovered from the final MSD curve alone. Appendix B illustrates these requirements with a representative simulation setup.
Alternatively, save the trajectory and calculate the MSD after the simulation. Coordinates must be unwrapped consistently before computing displacements; particle identities and the box information needed for unwrapping must therefore be retained. Post-processing makes it easier to change selections, reference frames, and lag ranges, but requires sufficient coordinate output and storage. Appendix A defines the estimator and its direct and FFT evaluations.
Once a correctly defined and documented MSD has been obtained by either route, the subsequent diffusion analysis can proceed.
CLI tip. The companion tool
msd_check.pyexpects exactly this two-column input (lag_time,MSD), as produced by LAMMPScompute msd(total column) or by post-processing packages.
Figure 2 shows a pre-computed MSD from a 600 ns record with frames saved every 0.1 ns. The example illustrates how the curve, enlargement, and candidate fit should be interpreted; its displayed range and 80–150 ns fit do not by themselves establish a validated diffusion window.

Figure 2. Linear-axis MSD. (a) The measured MSD (purple), with the linear fit
Lag time
These sampling properties determine how the data should be interpreted. The next step is to decide which part, if any, supports a diffusion estimate.
A candidate diffusive interval should show a sustained, approximately constant positive linear slope after early relaxation and before the poorly sampled tail. On linear axes, define
For three-dimensional isotropic diffusion,
The logarithmic slope
is useful for identifying the motion regimes in Section 1, but it does not measure the magnitude of
A linear diffusive interval need not have
A positive offset gives
As a consistency check, use the fixed fitted intercept to inspect the corrected measured MSD,
Figure 3 applies this check to the 80–150 ns fit in Figure 2.

Figure 3. Logarithmic MSD and slopes. (a) Measured MSD on log–log axes and the linear fit
Choose the candidate window from a sustained linear slope and stability under nearby window choices, not by requiring the raw logarithmic slope to equal one. Section 5 points to the remaining residual and uncertainty checks.
After selecting a candidate interval as in Section 4, fit
The considerations discussed above can be translated into a simple practical workflow for extracting diffusion coefficients from molecular dynamics trajectories in a consistent and reproducible manner. MSDs can be calculated using packages such as freud-analysis,[8] TRAVIS,[9] or TAME.[10] Regardless of the software used, the physical interpretation and extraction of diffusion coefficients should follow the same general procedure.
Before reporting a diffusion coefficient, the following workflow is recommended:
-
Prepare the trajectory. Use equilibrated production data, unwrap coordinates across periodic boundaries, and define the particle selection and reference frame appropriate to the transport process of interest.
-
Calculate the MSD. Compute the time-origin-averaged MSD over the accessible range of lag times, using a sufficient number of time origins to obtain adequate statistical averaging.
-
Identify the dynamical regime. Inspect the MSD on log–log axes and evaluate the local logarithmic slope $$ \beta(\tau)=\frac{d\log M(\tau)}{d\log\tau}. $$ This diagnostic helps distinguish short-time ballistic, caged, subdiffusive, and crossover behavior from a candidate long-time diffusive regime. The value of
$\beta(\tau)$ should be used as a diagnostic of the dynamical regime rather than as the sole criterion for selecting the fitting interval. -
Fit the diffusive window. On linear axes, identify a sustained interval over which the MSD is well described by a linear function of lag time and fit $$ M(\tau)=A+B\tau. $$ For three-dimensional isotropic diffusion, $$ D=\frac{B}{6}. $$
-
Validate the fitted regime. Confirm that the fitted linear relation provides a consistent description of the MSD over the selected interval. As an additional check, examine the offset-corrected MSD, $$ M(\tau)-A, $$ which should be approximately proportional to
$\tau$ over the same interval, with a local logarithmic slope close to unity. In addition, perturb the lower and upper bounds of the fitting window and verify that the fitted slope$B$ , and hence$D$ , remains stable within the statistical uncertainty.
This workflow deliberately separates the identification of the long-time diffusive regime from the final estimation of the diffusion coefficient. The log–log analysis is used to diagnose the underlying dynamical behavior, whereas the diffusion coefficient is obtained from a direct linear fit to the MSD on linear axes. The offset-corrected MSD and fitting-window sensitivity then provide complementary consistency checks before the final value of
One-click CLI. With a two-column MSD file ready, run:
python msd_check.py examples/msd.dat --window 80 150See README.md for options.
With a particle selection and reference frame specified, direct averaging and the FFT method evaluate the same time-origin-averaged MSD estimator. They differ in computational cost, not in the information extracted from a trajectory.
For
For several equivalent particles, their squared displacements are averaged, not their positions. Periodic coordinates are unwrapped consistently before forming displacements as wrapped coordinates can create false jumps or artificial saturation.
Computing every lag costs
At large lags, few starting frames remain. Moreover, overlapping displacements are correlated:
The FFT method evaluates the same estimator more efficiently by expressing the repeated products as an autocorrelation. For one coordinate, expanding
Here
Zero-pad to at least
Subtracting a fixed coordinate offset can reduce cancellation between large terms without changing displacements. Verify the implementation against direct averaging on a short record, including large lags and a translated copy of the coordinates. Do not hide numerical failures by clipping negative results.
Before applying the MSD estimator, establish that the trajectory samples the intended physical state. Assume that the interaction model, particle masses, initial positions and velocities, and simulation box have been defined. The remaining choices are the ensemble, integration timestep, temperature and pressure controls, and sampling interval.
Specify the boundary conditions and the numerical settings of the interaction model, including cutoffs and any long-range accuracy requirements. Choose the target temperature
The integration timestep
Exclude equilibration from the MSD average and retain uniformly spaced production frames at interval
The temp/csvr fix implements the Bussi–Donadio–Parrinello thermostat.[13] For pressure control, it can be paired with fix nph. LAMMPS uses the Shinoda formulation, combining Martyna–Tobias–Klein hydrostatic equations with Parrinello–Rahman strain energy; this is not a literal implementation of the original Parrinello–Rahman equations.[14]
The following parameter block assumes an already defined, three-dimensional periodic system with nonzero thermal velocities. The variables dt, Ttarget, Ptarget, Tdamp, Pdamp, and seed must have values assigned in the chosen unit convention. They represent
# LAMMPS — Temperature and pressure control
timestep ${dt}
fix thermal all temp/csvr ${Ttarget} ${Ttarget} ${Tdamp} ${seed}
fix pressure all nph iso ${Ptarget} ${Ptarget} ${Pdamp} &
    ptemp ${Ttarget} mtk yes pchain 0
Here iso couples the box lengths under a common pressure; it does not allow independent shear deformation. A fully flexible cell instead uses tri with a triclinic box. The ptemp setting supplies the reference temperature for the barostat, mtk yes retains the ensemble correction, and pchain 0 disables a separate thermostat chain on the barostat variables.[14]
fix nph already integrates positions and velocities, whereas fix temp/csvr changes velocities for temperature control only. Do not add fix nve to the same atoms, or replace nph with npt while retaining CSVR: those choices would respectively duplicate integration or particle thermostatting.[13,15]
LAMMPS can also accumulate an MSD during the production run with its built-in compute msd command. The following example assumes that the atoms of interest have already been assigned to a group named mobile, and that msdEvery and nsteps are positive integer variables. Setting the two averaging counts in fix ave/time to one writes instantaneous compute values rather than an additional running average.
# LAMMPS — Built-in MSD during production
compute msd_mobile mobile msd com yes
fix msd_output all ave/time ${msdEvery} 1 ${msdEvery} &
    c_msd_mobile[1] c_msd_mobile[2] c_msd_mobile[3] &
    c_msd_mobile[4] file msd.dat

run ${nsteps}
The output columns after the timestep are the group-averaged squared displacements in c_msd_mobile[4], is the three-dimensional MSD to which
The option com yes removes translation of the selected group's center of mass. Use it only when diffusion relative to that center of mass is the intended observable; omit it when collective translation is physical. Do not use average yes for diffusing particles: that option updates the reference coordinates and is intended for atoms that vibrate about fixed mean positions. The compute identifier should also be preserved across a continued run or restart when continuity with the stored reference positions is required.[16]
Unlike Eq. (A1), compute msd uses one fixed reference configuration. It averages over atoms in the group but does not average over multiple time origins. It is therefore useful for online monitoring and for sufficiently large particle ensembles, whereas the direct or FFT post-processing estimators are preferable when a time-origin-averaged MSD and block-based uncertainty analysis are required. Outputting compute msd more frequently does not create additional time origins.
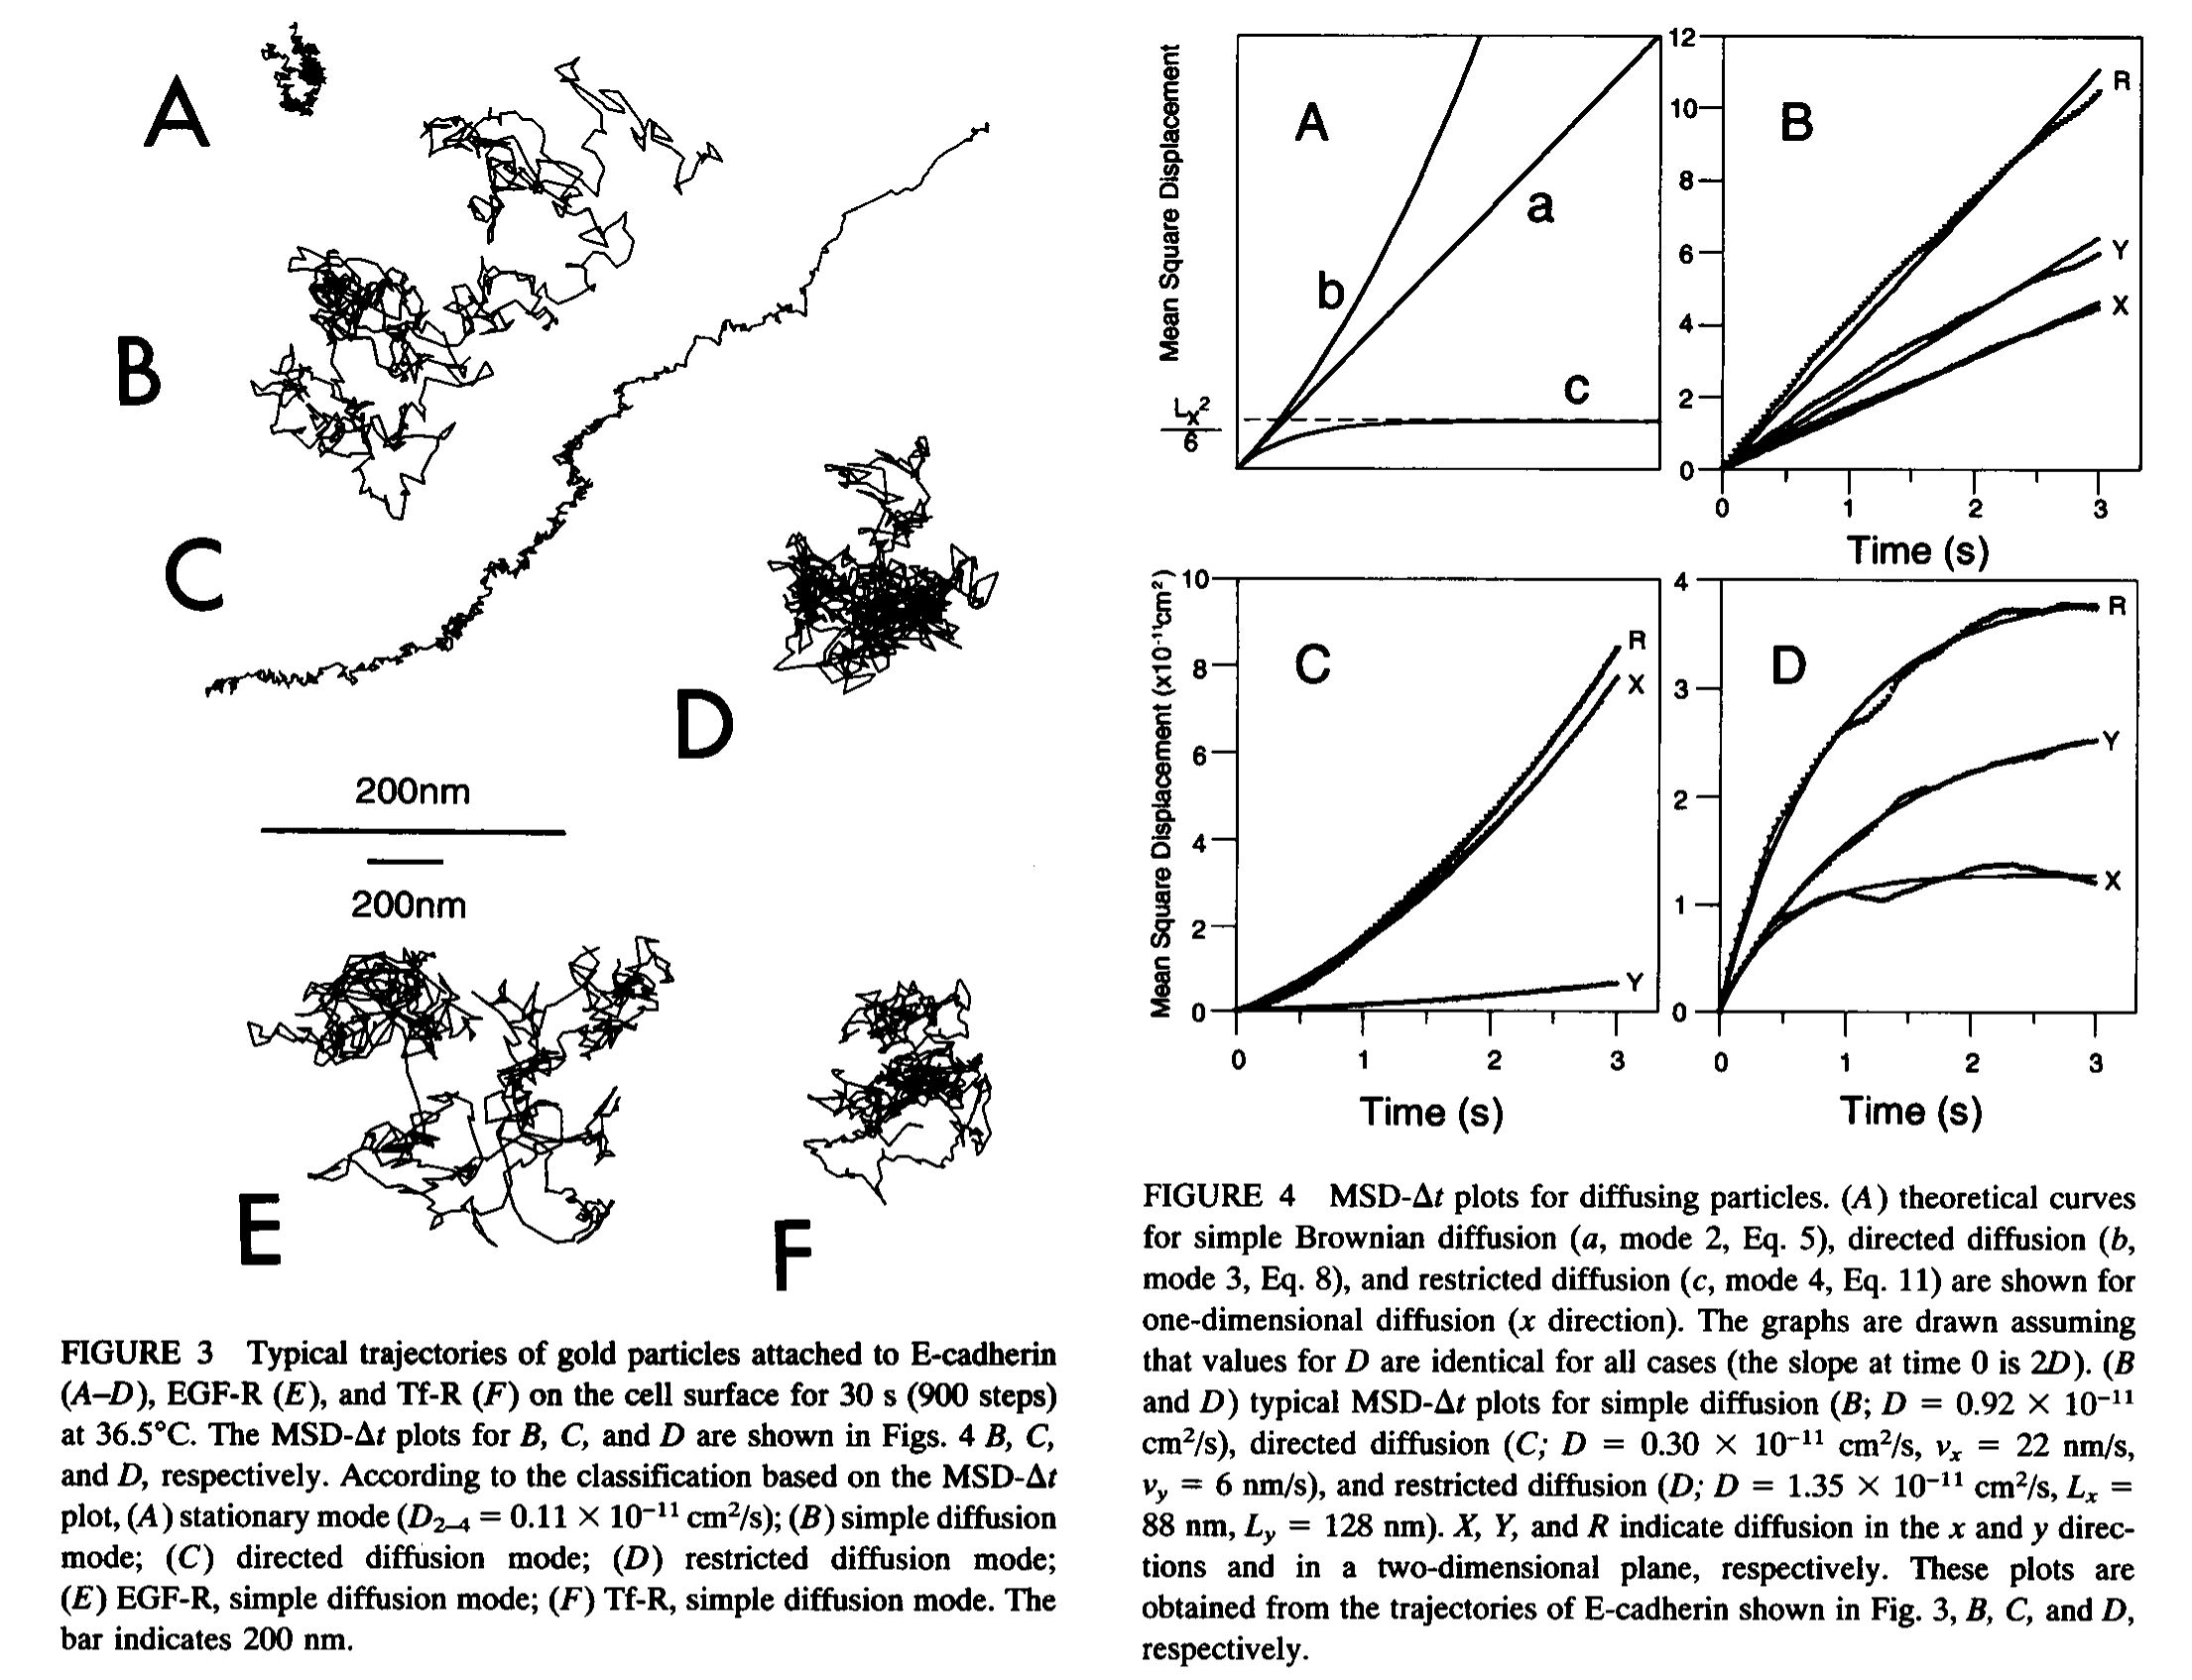
Two different classifications are useful and should not be confused. A motion pattern describes the overall spatial behavior of a trajectory or model. A lag-time regime instead describes how the same trajectory behaves over one range of observation durations. For example, directed motion is an overall pattern caused by drift, whereas ballistic motion is normally a short-lag regime caused by velocity persistence. Likewise, confinement is an overall bounded pattern, whereas caging can be a temporary intermediate-lag regime followed by diffusion.
Figure 4 compares four idealized motion patterns and their MSDs.
Stationary motion. The position does not change, so
Brownian motion. Unbiased steps produce ordinary diffusion. The MSD grows linearly with
Directed motion. A constant drift added to Brownian motion gives
Confined motion. The particle moves locally but remains within a finite region, so the MSD approaches a plateau.
The four panels show alternative examples, not successive stages of one trajectory.

Figure 4. Motion patterns. Independently generated examples of stationary, Brownian, directed, and confined motion, following the four-pattern comparison of Kusumi et al.[17] as illustrated in the reference supplied by Jerkwin.[18] Top: synthetic two-dimensional paths with equal spatial scale. Bottom: analytical ensemble MSDs on linear and log–log axes, not MSD estimates from the individual paths above. Confinement is represented by stationary harmonic trapping; the directed curve includes drift, not inertial ballistic motion. The panels represent separate motion models, not lag-time regions of one trajectory. All units are arbitrary; these are not experimental or EMD results.
This appendix defines the synthetic processes used only in Figure 4. They illustrate known motion regimes; they are not the trajectory data used for diffusion estimation.
Synthetic paths. Let
Draw
Use equal spatial scales for the path panels and the same time interval for both MSD panels. Omit
-
A. Einstein, Über die von der molekularkinetischen Theorie der Wärme geforderte Bewegung von in ruhenden Flüssigkeiten suspendierten Teilchen, Ann. Phys. 322, 549–560 (1905). doi:10.1002/andp.19053220806.
-
R. Huang, I. Chavez, K. M. Taute, B. Lukić, S. Jeney, M. G. Raizen, and E.-L. Florin, Direct observation of the full transition from ballistic to diffusive Brownian motion in a liquid, Nat. Phys. 7, 576–580 (2011). doi:10.1038/nphys1953.
-
E. R. Weeks and D. A. Weitz, Subdiffusion and the cage effect studied near the colloidal glass transition, Chem. Phys. 284, 361–367 (2002). doi:10.1016/S0301-0104(02)00667-5.
-
J. Klafter, A. Blumen, and M. F. Shlesinger, Stochastic pathway to anomalous diffusion, Phys. Rev. A 35, 3081–3085 (1987). doi:10.1103/PhysRevA.35.3081.
-
M. V. Chubynsky and G. W. Slater, Diffusing diffusivity: A model for anomalous, yet Brownian, diffusion, Phys. Rev. Lett. 113, 098302 (2014). doi:10.1103/PhysRevLett.113.098302.
-
J. T. Bullerjahn, S. von Bülow, and G. Hummer, Optimal estimates of self-diffusion coefficients from molecular dynamics simulations, J. Chem. Phys. 153, 024116 (2020). doi:10.1063/5.0008312.
-
E. J. Maginn, R. A. Messerly, D. J. Carlson, D. R. Roe, and J. R. Elliot, Best Practices for Computing Transport Properties 1. Self-Diffusivity and Viscosity from Equilibrium Molecular Dynamics [Article v1.0], Living J. Comput. Mol. Sci. 1(1), 6324 (2018). doi:10.33011/livecoms.1.1.6324.
-
V. Ramasubramani, B. D. Dice, E. S. Harper, M. P. Spellings, J. A. Anderson, and S. C. Glotzer, freud: A software suite for high throughput analysis of particle simulation data, Comput. Phys. Commun. 254, 107275 (2020). doi:10.1016/j.cpc.2020.107275.
-
M. Brehm, M. Thomas, S. Gehrke, and B. Kirchner, TRAVIS—A free analyzer for trajectories from molecular simulation, J. Chem. Phys. 152, 164105 (2020). doi:10.1063/5.0005078.
-
Y. Shao, TAME: Trajectory Analysis Made Easy. Archived software repository.
-
P. de Buyl, tidynamics: A tiny package to compute the dynamics of stochastic and molecular simulations, J. Open Source Softw. 3(28), 877 (2018). doi:10.21105/joss.00877.
-
LAMMPS developers, Unit conventions. docs.lammps.org/units.html.
-
LAMMPS developers, Canonical velocity-rescaling thermostat. fix temp/csvr.
-
LAMMPS developers, Extended-system integration and pressure control. fix nph.
-
LAMMPS developers, Barostats. Howto barostat.
-
LAMMPS developers, Compute mean-squared displacement. compute msd.
-
A. Kusumi, Y. Sako, and M. Yamamoto, Confined lateral diffusion of membrane receptors as studied by single particle tracking (nanovid microscopy). Effects of calcium-induced differentiation in cultured epithelial cells, Biophys. J. 65, 2021–2040 (1993). doi:10.1016/S0006-3495(93)81253-0.
-
Jerkwin, MSD motion-pattern reference image. jerkwin.github.io/pic/msd.png.